Window Function Calculator
Compare FFT window tradeoffs for audio DSP: coherent gain, ENBW, bin spacing, leakage, scalloping loss, amplitude correction, and overlap planning.
🎯Analysis Presets
🎛FFT Window Inputs
📊Selected Window Spec Grid
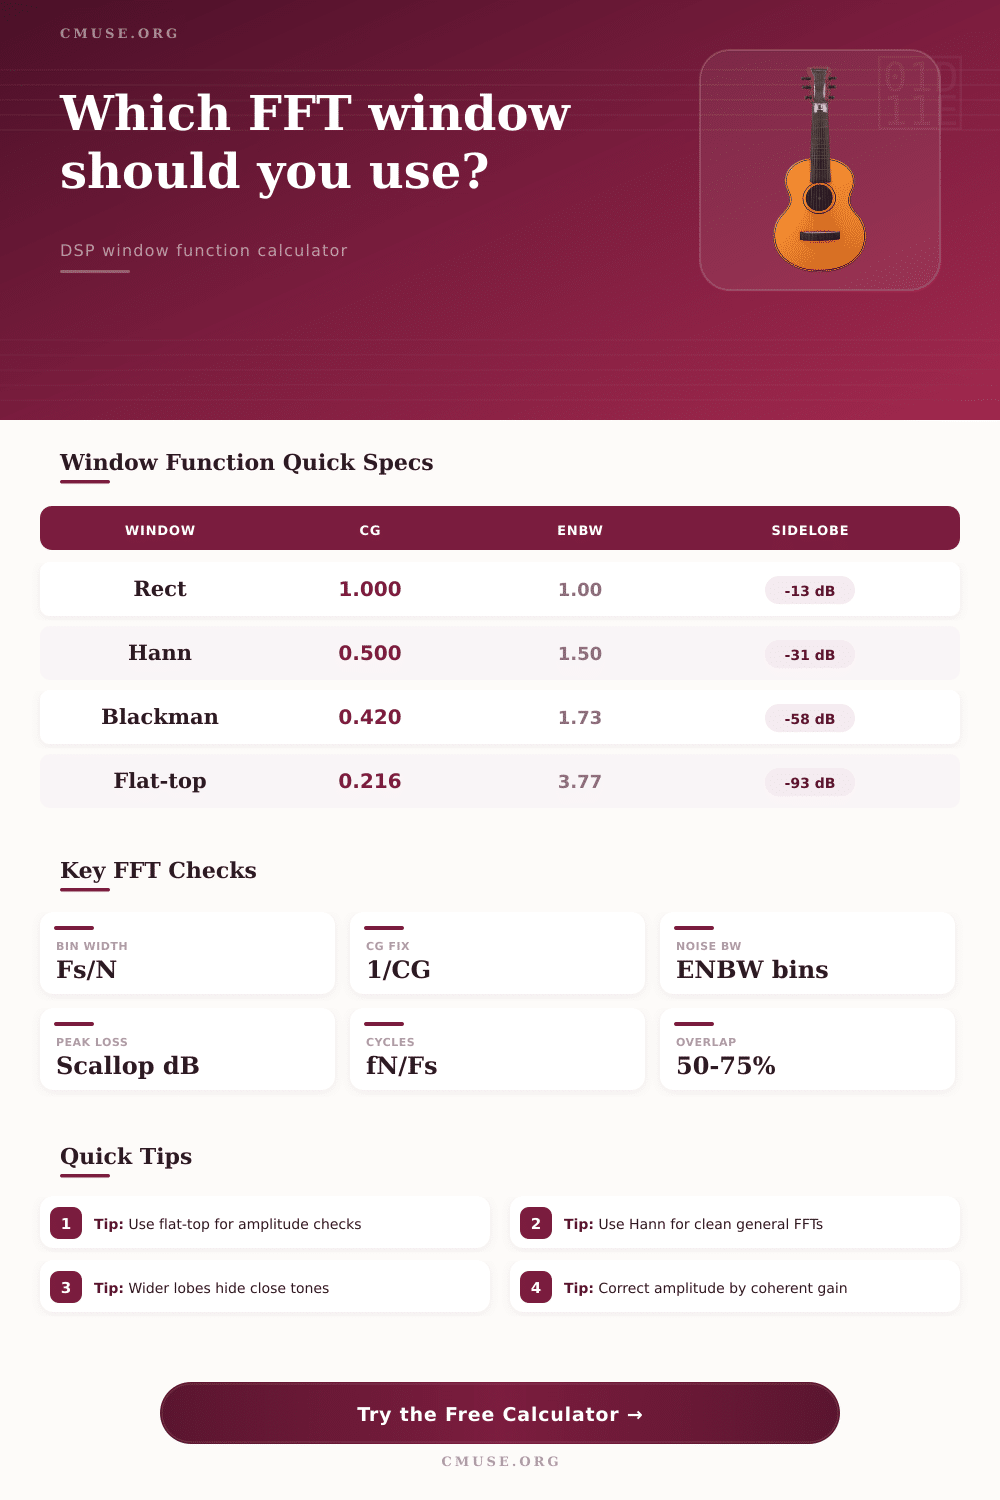
📚Window Function Reference
| Window | Best Use | Coherent Gain | ENBW | Peak Sidelobe | Scalloping |
|---|---|---|---|---|---|
| Rectangular | Coherent tones, exact bin tests | 1.000 | 1.00 bins | -13 dB | -3.92 dB |
| Hann | General audio spectrum work | 0.500 | 1.50 bins | -31 dB | -1.42 dB |
| Hamming | Narrower lobe than Hann | 0.540 | 1.36 bins | -43 dB | -1.78 dB |
| Blackman | Cleaner leakage rejection | 0.420 | 1.73 bins | -58 dB | -1.10 dB |
| Blackman-Harris | Deep dynamic-range checks | 0.359 | 2.00 bins | -92 dB | -0.83 dB |
| Flat-top | Accurate amplitude readings | 0.216 | 3.77 bins | -93 dB | -0.01 dB |
| Kaiser beta 6 | Adjustable leakage control | 0.500 | 1.47 bins | -44 dB | -1.50 dB |
| Kaiser beta 8.6 | High rejection analysis | 0.421 | 1.72 bins | -63 dB | -1.10 dB |
| Tukey 50% | Transient-friendly compromise | 0.750 | 1.22 bins | -15 dB | -2.24 dB |
| Bartlett | Simple triangular smoothing | 0.500 | 1.33 bins | -27 dB | -1.82 dB |
🔀Common Audio FFT Project Sizes
| Scenario | Typical Fs / N | Resolution | Window Choice | Tradeoff |
|---|---|---|---|---|
| Live analyzer | 48 kHz / 1024 | 46.88 Hz | Hann | Fast update, moderate leakage |
| Instrument tuner | 48 kHz / 8192 | 5.86 Hz | Hann | Stable pitch bins |
| Noise floor audit | 96 kHz / 65536 | 1.46 Hz | Blackman-Harris | Deep sidelobe rejection |
| Amplitude calibration | 48 kHz / 32768 | 1.46 Hz | Flat-top | Low peak error, wide lobe |
| Room mode scan | 48 kHz / 16384 | 2.93 Hz | Blackman | Low-frequency separation |
| Drum transient FFT | 48 kHz / 512 | 93.75 Hz | Tukey 50% | Shorter time blur |
🧮Formula Cross-Checks
| Quantity | Formula | Why It Matters | Watch For |
|---|---|---|---|
| Bin width | Fs / N | Frequency grid spacing | Too coarse for close partials |
| Record time | N / Fs | Time captured by one FFT | Long records smear changes |
| Coherent gain | mean(window) | Peak amplitude loss | Must correct sine levels |
| ENBW | N sum(w2) / sum(w)2 | Noise bandwidth per bin | Wide windows raise noise bins |
| Scalloping loss | half-bin peak loss | Worst off-bin amplitude error | Flat-top minimizes this |
| Hop size | N x (1 - overlap) | STFT frame advance | High overlap costs CPU |
💡DSP Window Tips
Spectral leakage are a phenomenon that occurs during a Fast Fourier Transform. Spectral leakage happens because the Fast Fourier Transform assume that the signal will repeat itself perfectly within every window. Because the signal does not always align with the bins of a Fast Fourier Transform, this causes mathematical artifact in the plot of the signals frequencies.
These mathematical artifacts is known as spectral leakage. To avoid spectral leakage, it is necessary to use window functions to fade the signal to zero at the edges of the signal. Using window functions can force the math to behave, but it comes with trade-offs.
Spectral Leakage and Window Functions
If a window function is chosen to reduce spectral leakage, it will widen the main lobe of the signal. If the main lobe of a signal are too wide, two close frequencies will be measured as one signal blob. So, there is a trade-off between measuring the loudness of the tone and seeing the exact frequency of the tone.
When using window functions, there is a value call the coherent gain. Coherent gain represent the amount of signal energy that the window function remove when fading the signal to zero at its edges. If you dont account for the coherent gain, the measured decibel level will be lower than the actual signal levels.
In order to find the true signal level, you must add the coherent gain to the peak reading of the signal. In addition to coherent gain, there is another consideration: scalloping loss. Scalloping loss happen when a frequency falling between two bins of the Fast Fourier Transform creates the dip in amplitude.
Certain window functions, like the Flat-top window, are used to minimize scalloping loss. The Flat-top window will provide consistent reading of amplitude, but it has a massive main lobe. The main lobe of a signal represent the frequency resolution of the signal; the more larger the main lobe, the more frequencies within close proximity will be visible as one signal blob.
If you are building a pitch tracker, you might choose a Hann window because a Hann window offer a balance between low spectral leakage and a manageable main lobe. The relationship between the sample rate and the FFT size is critical to understanding the FFT. Many people find the relationship between the sample rate and the FFT size difficult to understand.
The bin width tell you the width of each grid in your FFT analysis. The noise bandwidth tell you how much noise will leak into each bin in your analysis. If you increase the FFT size in an attempt to improve your frequency resolution, you are essentially looking at a longer slice of time.
A longer slice of time is good for steady tone. The problem with looking at a long slice of time is that fast transients in that time will smear out in the spectrum. To combat this problem and maintain the integrity of fast transients in your audio file, you can use a Tukey window.
A Tukey window will keep the center of your signal flat and only fade the ends of your signal. This will allow fast transients to maintain it’s integrity while still cleaning up the edges of your signal. You also have to choose the right overlap for your Short-Time Fourier Transform.
You must use an overlap to avoid losing information from your signal. By overlapping the frames in your Short-Time Fourier Transform, every sample in your signal will be weighted to contribute to the analysis at least once. Additionally, by overlapping the frames of your signal, you will prevent the spectrum from flickering.
Many audio engineer will use a 50% or 75% overlap between frames. A 50% or 75% overlap will keep the transitions of your signal smooth. Finally, you must choose the appropriate window function for your analysis.
If you are looking to find a small harmonic close to a large fundamental frequency, you will want to use a Blackman-Harris window because it has deep rejection of the sidelobes in its spectrum. If you simply want to get a visual representation of your vocal track, you can use a Hamming window. The choice of window function come down to the error in spectral analysis that you are willing to accept for your specific application.