Weighted Decibel Calculator
Combine octave-band sound levels with A, C, Z, or B weighting, then estimate normalized exposure from the same measurement set.
🎯Scenario Presets
🎚Weighting Inputs
📊Curve Facts
📐Octave-Band Weighting Reference
| Center Frequency | A Weight | C Weight | Z Weight | B Weight |
|---|---|---|---|---|
| 31.5 Hz | -39.4 dB | -3.0 dB | 0.0 dB | -17.1 dB |
| 63 Hz | -26.2 dB | -0.8 dB | 0.0 dB | -9.3 dB |
| 125 Hz | -16.1 dB | -0.2 dB | 0.0 dB | -4.2 dB |
| 250 Hz | -8.6 dB | 0.0 dB | 0.0 dB | -1.3 dB |
| 500 Hz | -3.2 dB | 0.0 dB | 0.0 dB | -0.3 dB |
| 1 kHz | 0.0 dB | 0.0 dB | 0.0 dB | 0.0 dB |
| 2 kHz | +1.2 dB | -0.2 dB | 0.0 dB | -0.1 dB |
| 4 kHz | +1.0 dB | -0.8 dB | 0.0 dB | -0.7 dB |
| 8 kHz | -1.1 dB | -3.0 dB | 0.0 dB | -2.9 dB |
| 16 kHz | -6.6 dB | -8.5 dB | 0.0 dB | -8.4 dB |
⏱Exposure and Level Reference
| Weighted Level | 3 dB Exchange Time | 5 dB Exchange Time | Typical Audio Context |
|---|---|---|---|
| 80 dB | 25.4 hr | 16 hr | Controlled edit room |
| 85 dB | 8 hr | 8 hr | Loud rehearsal average |
| 88 dB | 4 hr | 5.3 hr | Small live stage |
| 91 dB | 2 hr | 3.5 hr | Monitor-heavy stage |
| 94 dB | 1 hr | 2.3 hr | Club mix position |
| 100 dB | 15 min | 52 min | Near loud backline |
🎵Common Weighted dB Scenarios
| Scenario | Curve to Check | Why It Matters | Band Clue |
|---|---|---|---|
| Mix control room | A and Z | Compare hearing-weighted level with raw spectrum | 500 Hz to 4 kHz balance |
| Subwoofer tuning | C and Z | Low bands stay visible instead of being heavily reduced | 31.5 Hz to 125 Hz energy |
| Vocal booth noise | A | Noise audibility follows midrange sensitivity | 250 Hz to 2 kHz buildup |
| Stage monitor line | A and C | Shows both exposure estimate and bass contribution | 1 kHz to 8 kHz bite |
| Cinema reference | C | Useful when wide-band playback includes strong bass | 63 Hz and 4 kHz contrast |
💡Calculation Tips
Decibels is a measurement of sound pressure. However, decibels dont always represents how a person can hear a sound. Sound is not a single form of energy but exists as a spectrum of frequency.
The human ear are more sensitive to certain frequencies than others. To account for this, weighting curves is used to help people understand how sound affect them. One weighting curve commonly used are A weighting, which people use to estimate the damage that sound can do to human hearing.
How Sound Weighting Changes What We Hear
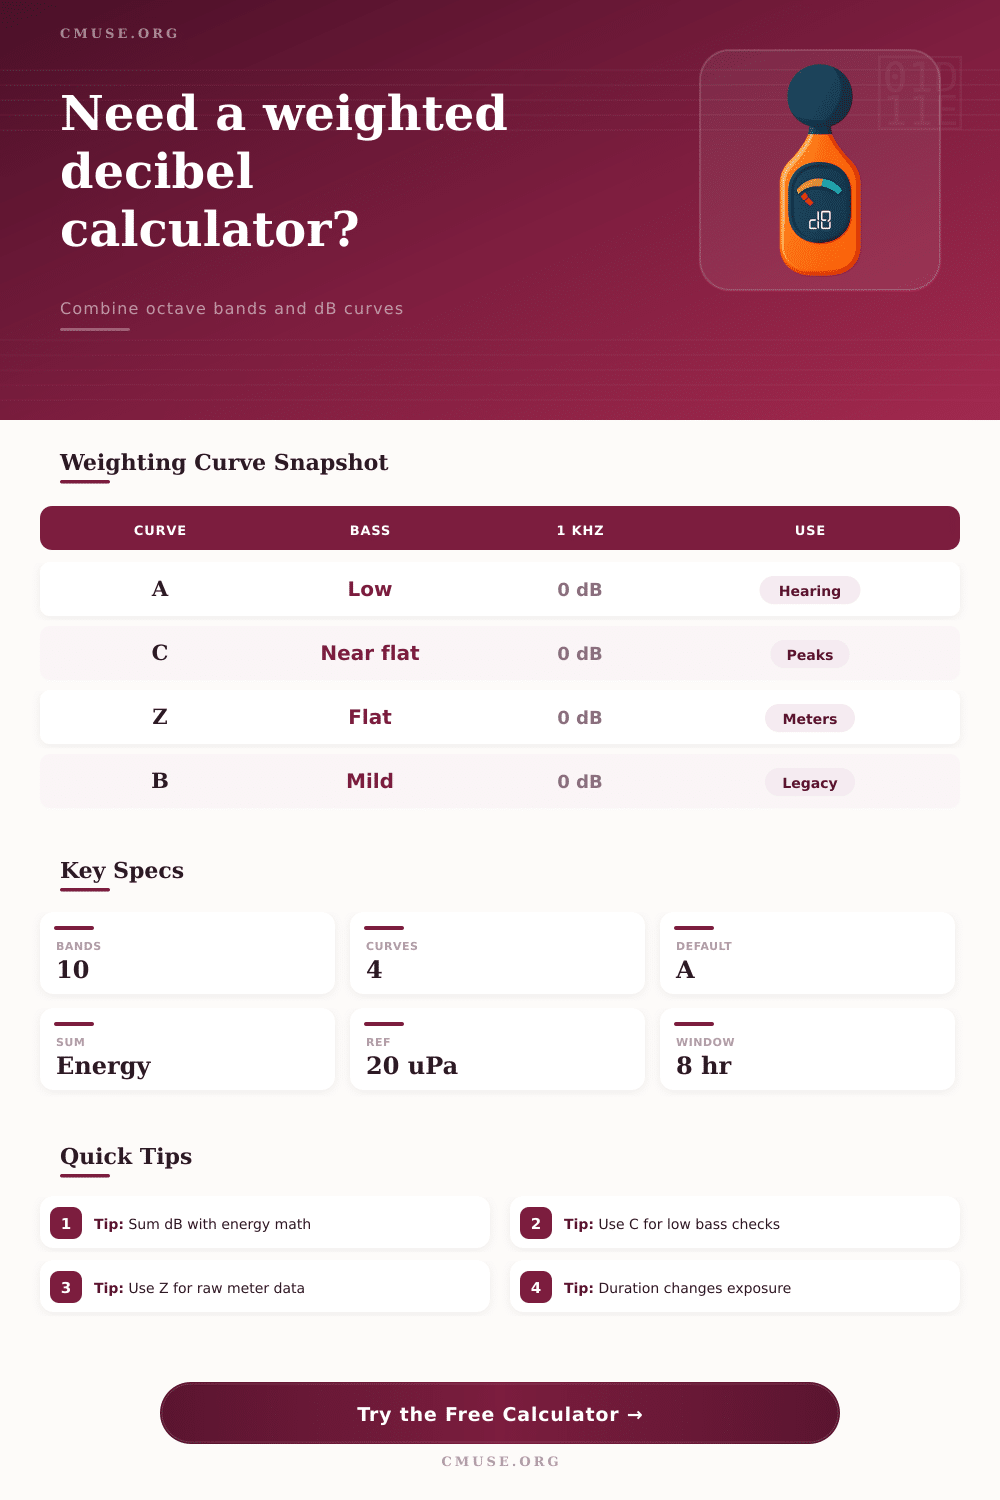
A weighting is helpful because it remove the low frequencies from the sound measurement. The human ear is less sensitive to low frequencies than the midrange frequency that humans hear most often. However, A weighting cannot be used to measure bass frequencies because it removes those bass frequencies from the measurement.
In this case, C weighting should of be used instead. C weighting creates a flatter curve in the sound measurement and allows the low frequencies to remains in the sound measurement. By measuring A weighting and C weighting, the difference in the two can tell the listener how much bass energy is in the environment.
Other weighting curves include B weighting and Z weighting. B weighting is used to measure the loudness of the midrange frequencies. However, sound engineers dont commonly use B weighting.
Finally, Z weighting use a zero correction in its sound measurement and does not use any sound filters. Z weighting is helpful for sound engineers because it will measure the raw sound energy that is created by a speaker without any filters. Sound energy in decibels cannot be added together like standard numbers.
For example, two sound at 70 decibels will not combine to 140 decibels. Instead, two sounds of 70 decibels will equal 73 decibels. This is referred to as energy summation.
Therefore, taking the raw average of all decibel measurement is not a more helpful tool in calculating sound energy. Sound exposure consider the volume and the length of the sound. Exposure is not just loudness but how long the sound is in an environment.
For example, sound safety standard use the concept of exchange rate to determine how long a person can listen to a sound without damaging there hearing. The exchange rate for 85 decibels for eight hours could be 88 decibels for four hours. A short burst of loud sound can be damaging to the ear just as much as long period of moderate sound.
Finally, the weighting curve must be choose correctly based off what the sound engineers goal for the sound is. If the goal is to protect hearing or reduce speech interference, A weighting should be used. If the goal is to measure bass frequencies, C weighting should be used.
Therefore, the correct weighting curve will ensure that the sound energy is translated into a measurement that meets the specific need of the situation.