Streams Needed for Certification Calculator
Estimate how many eligible streams a single or album still needs for a certification threshold, then project the likely timing from current units, daily growth, market rules, and stream-to-unit ratios.
Load a real certification planning scenario, then adjust the market, release type, current streams, existing units, daily pace, eligibility percentage, ratio, and safety buffer.
Calculation Breakdown
| Market | Single Levels | Album Levels | Default Ratios In Calculator |
|---|---|---|---|
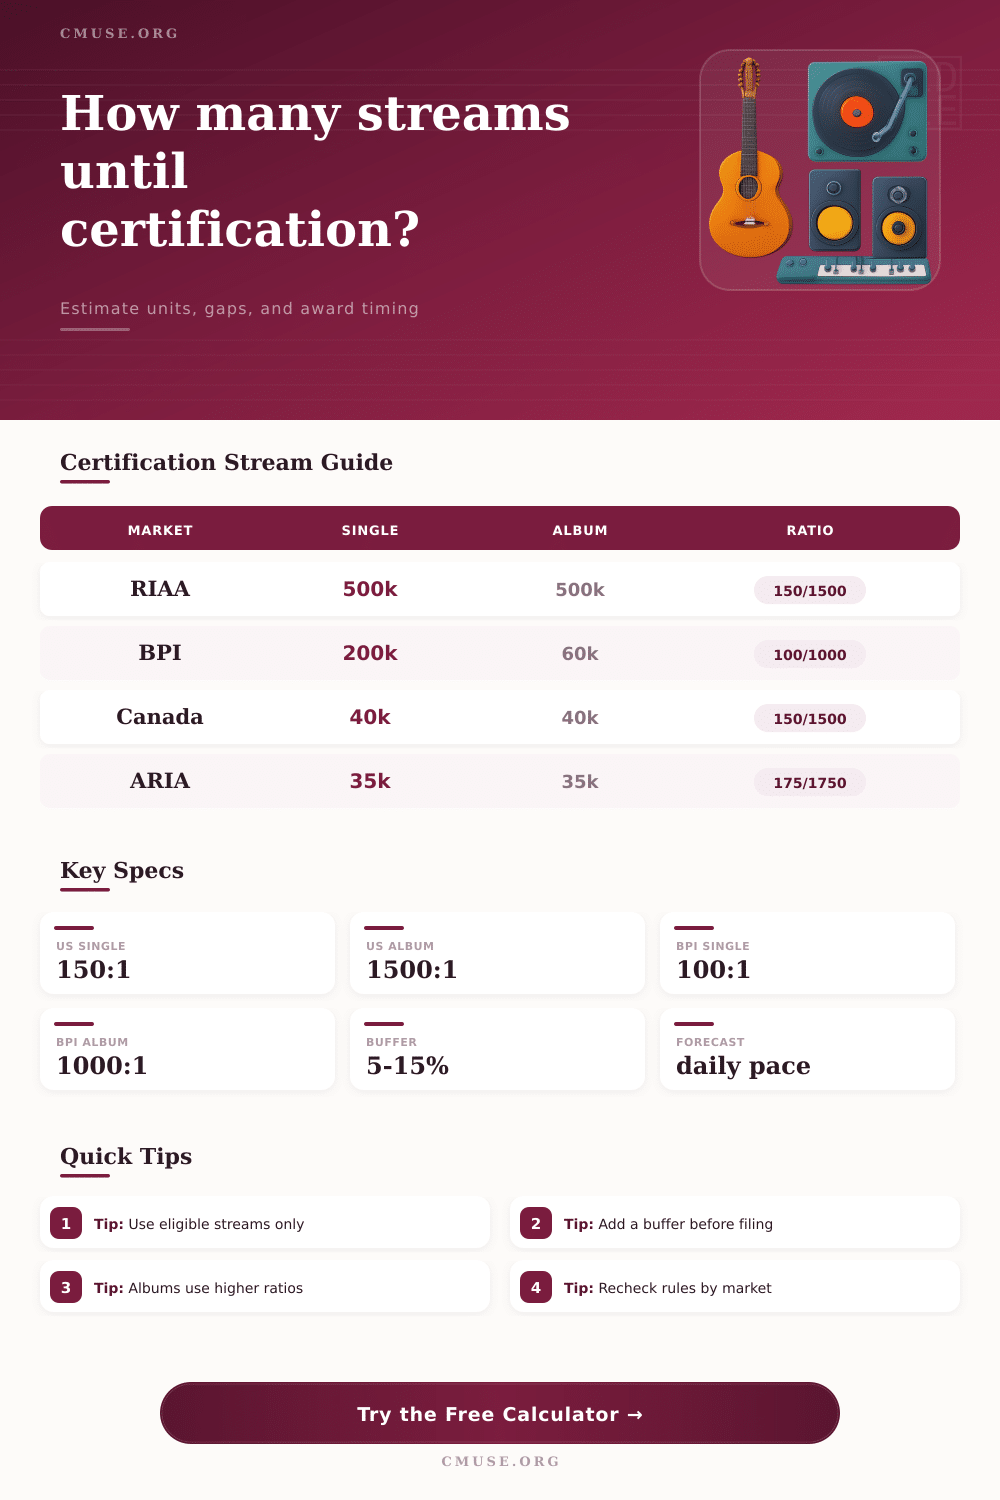
| United States - RIAA | Gold 500,000; Platinum 1,000,000; Diamond 10,000,000 units | Gold 500,000; Platinum 1,000,000; Diamond 10,000,000 units | 150 single 1500 album |
| United Kingdom - BPI | Silver 200,000; Gold 400,000; Platinum 600,000 units | Silver 60,000; Gold 100,000; Platinum 300,000 units | 100 single 1000 album |
| Canada - Music Canada | Gold 40,000; Platinum 80,000; Diamond 800,000 units | Gold 40,000; Platinum 80,000; Diamond 800,000 units | 150 single 1500 album |
| Australia - ARIA | Gold 35,000; Platinum 70,000 units | Gold 35,000; Platinum 70,000 units | 175 single 1750 album |
Use the custom target and custom ratio fields when an award body, distributor, or audit report gives a more specific rule for the release.
| Release Type | Common Planning Ratio | 1,000,000 Streams Become | Best Use |
|---|---|---|---|
| Single certification | 100 to 175 streams per track unit | 5,714 to 10,000 single units | Lead single, focus track, or standalone digital release |
| Album certification | 1,000 to 1,750 streams per album unit | 571 to 1,000 album units | Full album, EP bundle, or multi-track release counted as one album |
| Paid unit credit | Usually direct units before stream conversion | Not stream-based | Downloads, physical sales, and eligible direct album sales |
| Eligibility adjustment | Percentage applied before forecast units | 920,000 counted from 1,000,000 at 92% | Removing non-qualifying plays before estimating certification progress |
| Daily Eligible Streams | Single Units Per Month At 150:1 | Album Units Per Month At 1500:1 | Projection Meaning |
|---|---|---|---|
| 10,000 per day | About 2,000 units per 30 days | About 200 units per 30 days | Useful for early catalog momentum or niche album growth |
| 50,000 per day | About 10,000 units per 30 days | About 1,000 units per 30 days | Can close smaller market gaps quickly for single awards |
| 250,000 per day | About 50,000 units per 30 days | About 5,000 units per 30 days | Strong active campaign pace with meaningful monthly movement |
| 1,000,000 per day | About 200,000 units per 30 days | About 20,000 units per 30 days | Breakout single pace or major album launch period |
| Preset | Market And Type | Starting Progress | Purpose |
|---|---|---|---|
| RIAA Gold Single Push | US single, Gold target | 42.5M streams plus 60k units | Check the final gap before filing a first US award |
| RIAA Gold Album Track Set | US album, Gold target | 510M album streams plus 155k units | Estimate album-equivalent units from a broad track bundle |
| BPI Silver Single Sprint | UK single, Silver target | 14M streams plus 32k units | Forecast a lower threshold in a fast-moving single market |
| ARIA Platinum Single | Australia single, Platinum target | 9.5M streams plus 8k units | Measure how close a regional hit is to the next award |
It is a particular type of dread that comes with being 100k streams shy of gold. It feels like you’re so close to the finish line, but it keeps moving because no one can agree on how fast you’re moving. Glowing green numbers light up your dashboard. Yet, those raw play counts don’t mean jack shit unless they converts to certified units via an old trade association whose website probably hasn’t been updated since the days of dial-up internet.
This chasm between what you’re seeing on Spotify for Artists and what the RIAA/BPI/whatever will accept is where records stalls out, where labels lose sleep. While the mentioned calculator do all this work for you in translating those vague streams into real milestones, it’s equally crucial to grasp why numbers change.
How to Calculate Music Certification Requirements
Artists naturaly presume that a million streams = one million units. If that were true, your certification plan would of fail before you even begin. Streaming royalties and cert equivalents don’t use the same math at all. Because they perceive the act of listening passively as worth less then someone directly buying something, they imposes discount rates on each stream.
To reach the equivalent of one unit of sale (a single song) in the United States requires approximately 150 plays; for an album to be considered equal to one album-equivalent unit, it must surpass 1,500 streams. Those ratios aren’t a matter of opinion or loose recommendation, they’re ironclad benchmarks designed to maintain the perceived value of ownership vs. Access.
To get started, you’ll want to be aware of what the right ratio is for whatever kind of release you’re considering certifying. Fortunately, you can switch between single and album mode on the tool, and it makes a huge difference in how math plays out. In fact, if you’re thinking about streaming an album as though it were a bunch of singles, you’re likely going to believe you’ve got certification when you haven’t even come close.
The site has a handy chart of the different requirements. These vary greatly across markets, such as Australia, Canada and UK. This helps you see the right context for your market of interest. Then there’s the messiness of eligibility: Not all streams count. In many territories, plays by free-tier (non-paying) accounts are excluded; others limit number of plays per day (to avoid being artificially inflated).
The 10 million streams you see on your dashboard may be down to 8% coming from bot-heavy territories or flagged fraudulent account. This will knock your eligible total down significantly. A little bit of the calculator’s work with this is called adjusting for eligibility percent, and it saves you the embarrassment of submitting an application then having it thrown back at you for lacking enough verified data. You want to know the truth before you pay that filing fee. Then you’d better pay that filing fee.
The other hidden variable ignored by most is timing. Achieving certifications isn’t an instant process. It’s a historical record with an audit trail. You stream steadily every day, you can project when you’ll reach the threshold. But then you has to consider decay. A hot hit doesn’t remains so indefinitely. The calculator has an option where you input growth rate, letting you model if your momentum is increasing or decreasing. Perhaps your daily streams decline at a rate of 4% per month: That gold record you’re expecting in three months could instead come in nine.
Planning against current velocity vs. Peak popularity spares you missing out on the window for any promotional campaigns linked to those awards. It’s good practice to add some breathing room to your estimate. The trade association will take time to parse the information (which may also be several weeks/months after platform numbers). So if it shows you’re 100% of the bar, the audit will likely feel different; you’re still not over the top, but now you’ve got wiggle room. File at 90% confidence, with a 10% cushion so that while you’re waiting for them to count up, you’ll have cleared the hurdle. That takes what could be a nail-biting crapshoot and makes it a planned rollout.
Achieving certification isn’t a numbers game, it’s one of managing expectations against strict institutional guidelines. It’s not so much a stream as an engine with particular tolerances for acceptable input. Get to grips with the ratios; make adjustments for eligibility; factor in the delay in the official audit process, and that far-off piece of glittering metal becomes a tangible logistical target rather than a vague goal. The finish line may continue to move, but at least you know its rate of movement.