RMS to Peak-to-Peak Calculator
Convert audio or electronics signals from RMS into peak, peak-to-peak, min/max swing, and load power with waveform-aware presets.
💡 Signal Presets
🔧 RMS Inputs
📊 Formula Spec Grid
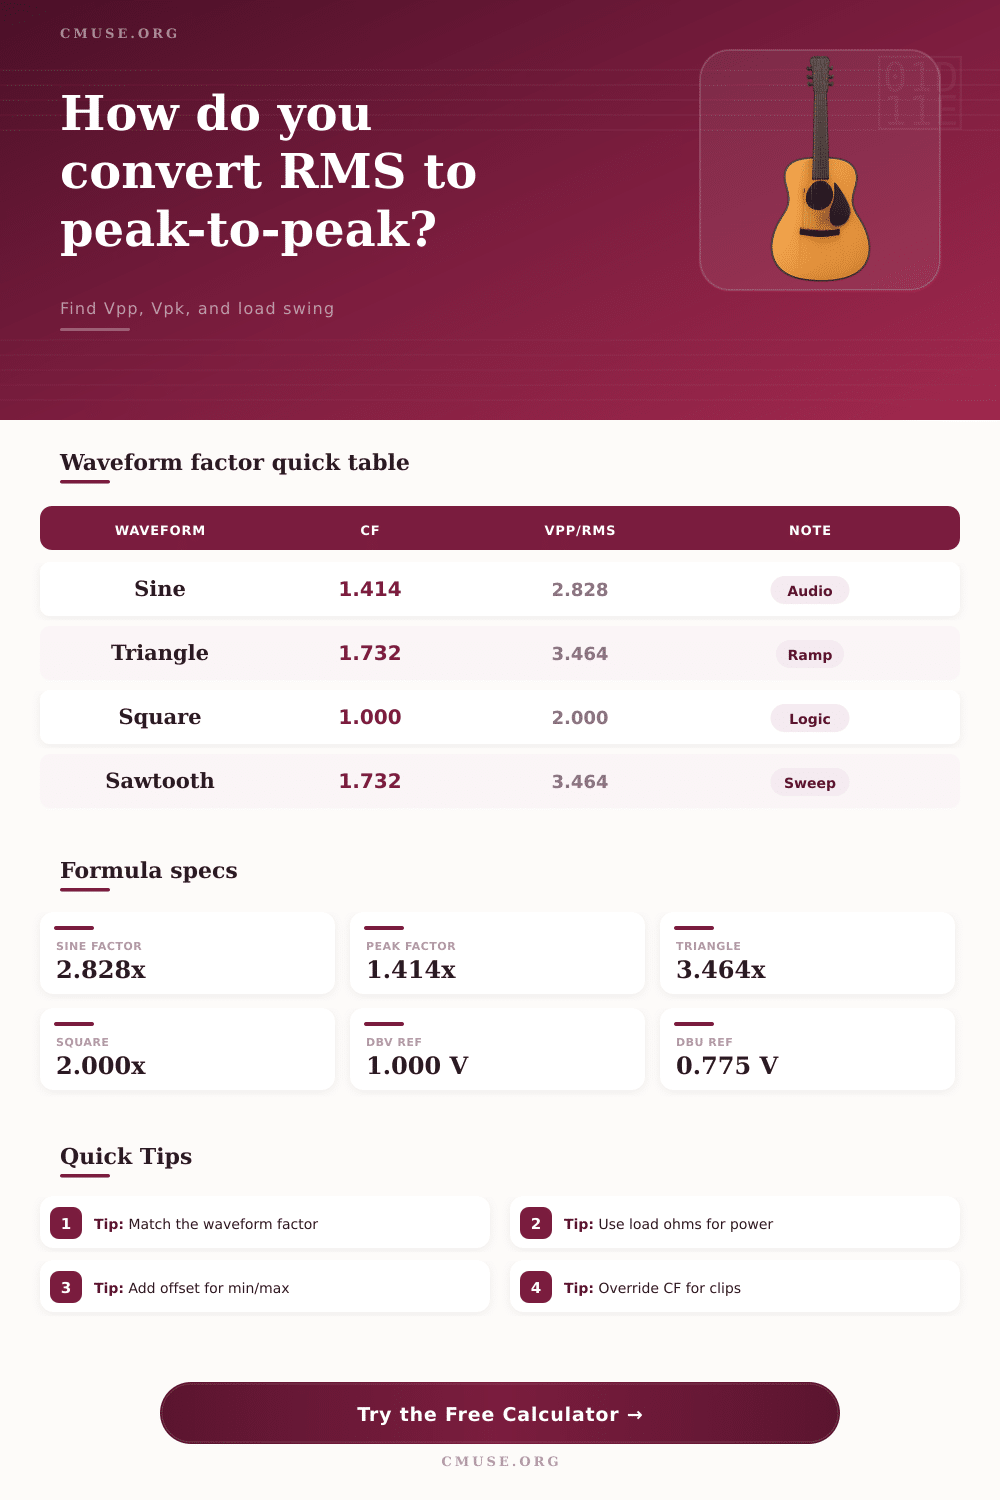
📈 Waveform Factor Table
| Waveform | Crest factor | Vpp / Vrms | Use case |
|---|---|---|---|
| Sine | 1.414 | 2.828 | Audio ref |
| Triangle | 1.732 | 3.464 | Scope test |
| Square | 1.000 | 2.000 | Logic rail |
| Sawtooth | 1.732 | 3.464 | Ramp sweep |
📋 RMS to Vpp Examples
| RMS value | Waveform | Peak | Peak-to-peak |
|---|---|---|---|
| 0.100 Vrms | Sine | 0.141 V | 0.283 Vpp |
| 0.316 Vrms | Sine | 0.447 V | 0.894 Vpp |
| 1.000 Vrms | Sine | 1.414 V | 2.828 Vpp |
| 2.000 Vrms | Triangle | 3.464 V | 6.928 Vpp |
📑 Audio Level Reference
| Level | Vrms | Vpp | Typical use |
|---|---|---|---|
| -10 dBV | 0.316 V | 0.894 Vpp | Consumer line |
| 0 dBV | 1.000 V | 2.828 Vpp | Reference line |
| 0 dBu | 0.775 V | 2.192 Vpp | Pro nominal |
| +4 dBu | 1.228 V | 3.470 Vpp | Studio line |
🔬 Load and Scope Table
| Load | Vrms | Current | Power |
|---|---|---|---|
| 600 ohm | 0.775 V | 1.29 mA | 1.0 mW |
| 10 k ohm | 1.000 V | 0.10 mA | 0.1 mW |
| 8 ohm | 2.000 V | 0.25 A | 0.500 W |
| 32 ohm | 1.000 V | 31.3 mA | 31.3 mW |
There are several key distinction between root mean square (RMS) voltage and peak-to-peak voltage when it comes to measuring electrical signals. The biggest difference between these two type of voltage is that an RMS voltage measurement represent the average effective voltage, but peak-to-peak voltage measurements represent the total voltage between the minimum and maximum voltage of a signal. Measuring the RMS voltage of a signal shows you an average value, but measuring the peak-to-peak voltage of a signal demonstrate the highest and lowest voltage of the signal.
Therefore, RMS voltage measurements only show an average voltage; they dont show the maximum voltage of a signal. Additionally, these measurement are related to each other by a factor called the crest factor. The crest factor measure the ratio of the peak voltage of a signal to the RMS voltage.
Difference Between RMS and Peak-to-Peak Voltage
To know this relationship, you must know the shape of the waveform you are measuring because the shape of the waveform determine the crest factor. For example, a sine wave has a specific crest factor of approximately 1.414. Therefore, multiplying 1.414 by the RMS voltage of a sine wave give you the peak voltage, and multiplying 2.828 by the RMS voltage of a sine wave gives you the peak to peak voltage.
However, different waveform have different crest factors. For example, a triangle wave has more higher crest factor than a sine wave, and a square wave has a lower crest factor than a sine wave. If you multiply 3.46 by the RMS voltage of a triangle wave, you will get its peak-to-peak voltage.
If you multiply the RMS voltage of a square wave by 2, you will get its peak-to-peak voltage. Therefore, you must know the shape of your waveform to know how to convert between RMS voltage and peak-to-peak voltages correct. There are also factors that affect the measurement of either RMS voltage or peak-to-peak voltage.
For example, the load resistance can impact the signal. Considering whether this load or resistance is high or low is essential within the context of your circuit. This is particularly important when measuring the parameters of an audio signal because this will impact other factors (i.e., if you apply 1 Vrms to an 8-ohm speaker).
Additionally, the presence of a DC offset can impact measurement. The DC offset can impact how the signal swing between it’s minimum and maximum voltage levels. However, it will not impact the RMS voltage of the signal.
Other factors may also affect these signal measurements, but load and DC offset are among the most important to consider. The biggest common mistake made between RMS and peak-to-peak voltages is assuming that your signal have a sine wave shape. The sine wave is often the default assumption because it is one of the most common waveforms, but there are several different type of waveforms that your signal could take.
Therefore, it is essential to measure these signals and properly identify the shape of your waveform before assuming a crest factor. This is essential for converting between RMS and peak-to-peak voltages properly. It is helpful to consider all of these factors in relation to measuring these signals for audio signals.
First, consider the implication of load because different loads will impact these signals differently. Additionally, while not specifically an audio signal, something to note about professional audio equipment is that it often use 0.775 Vrms as