RIC Rating Calculator
Estimate a room isolation class from one-third-octave band readings, partition area, room absorption, leakage penalties, and contour deficiencies.
The calculator treats RIC as a room isolation class estimate: source minus receiver level is corrected for receiver background, adjusted to apparent transmission loss using tested area and room absorption, then fitted to a shifted STC-style reference contour.
| Band | Source room dB | Receiver room dB | Corrected NR | Apparent TL | Contour deficiency |
|---|
Room Isolation Class Result
| Estimated RIC | Typical Room Use | Expected Isolation | Common Limiting Path |
|---|---|---|---|
| 30 to 34 | Office privacy, light edit room | Speech reduced but recognizable | Light door and ceiling plenum |
| 35 to 39 | Voice booth shell or practice nook | Speech mostly muted outside room | Door seals and outlet boxes |
| 40 to 44 | Podcast, vocal, quiet instrument room | Loud voice controlled in adjacent room | Low-frequency wall resonance |
| 45 to 49 | Project studio or teaching room | Moderate music contained for many uses | HVAC, glass, shared framing |
| 50 to 54 | Mix room, piano, amplified practice | Strong separation across speech bands | Sub-bass leakage and floor path |
| 55 plus | Drums, cinema, loud rehearsal shell | High isolation when flanking is controlled | Structure-borne paths and doors |
| Assembly Type | Likely RIC Range | Strong Bands | Watch Band |
|---|---|---|---|
| Single stud drywall wall | 32 to 38 | 1000 Hz to 4000 Hz | 125 Hz to 250 Hz |
| Double drywall with damping | 42 to 50 | 500 Hz to 4000 Hz | 160 Hz resonance |
| Staggered stud wall | 45 to 53 | 315 Hz to 3150 Hz | Door and perimeter seals |
| Double stud studio wall | 52 to 60 | 250 Hz to 4000 Hz | Shared floor and ceiling |
| Solid core door with seals | 32 to 42 | 500 Hz to 2000 Hz | Threshold and latch edge |
| Laminated studio window | 38 to 48 | 800 Hz to 4000 Hz | Coincidence dip near 2500 Hz |
| Concrete or masonry wall | 50 to 60 | 125 Hz to 4000 Hz | Penetrations and ductwork |
| Floating room shell | 60 plus | Full speech and music band | Structural bridges |
| Room Scenario | Room Size | Target RIC | Priority Check |
|---|---|---|---|
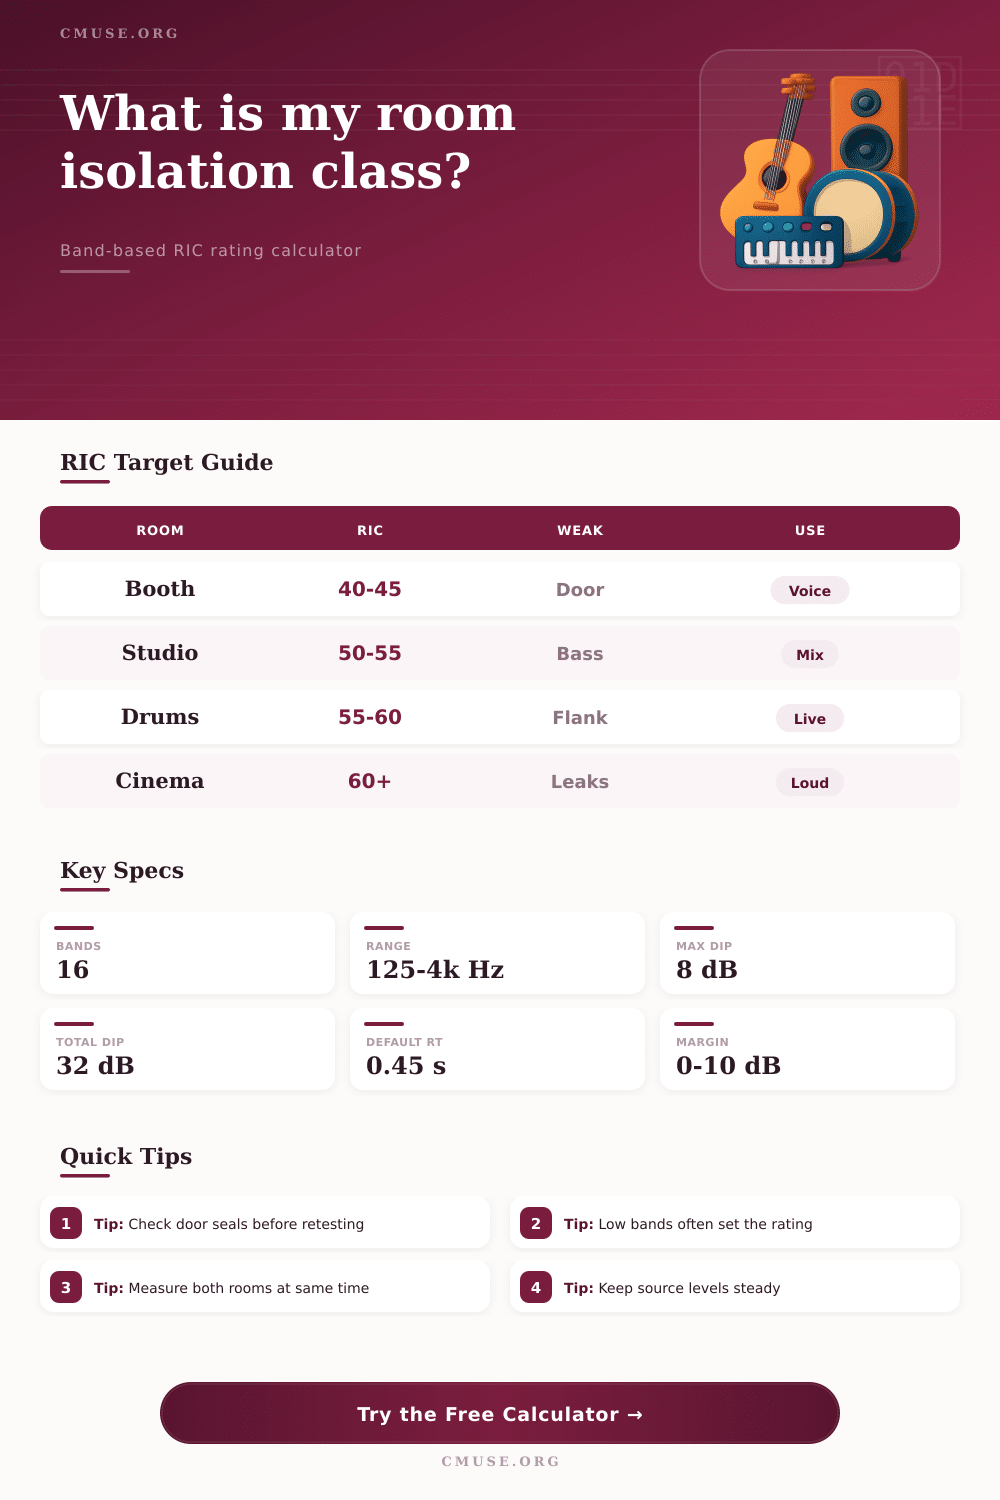
| Recording booth | 5 ft x 5 ft / 1.5 m x 1.5 m | 40 to 45 | Door perimeter and glass area |
| Practice room | 8 ft x 8 ft / 2.4 m x 2.4 m | 40 to 50 | Shared wall and ceiling path |
| Home studio | 10 ft x 12 ft / 3.0 m x 3.7 m | 45 to 55 | Low-frequency deficiency |
| Drum room | 12 ft x 14 ft / 3.7 m x 4.3 m | 55 to 60 | Floor impact and structure path |
| Cinema room | 16 ft x 22 ft / 4.9 m x 6.7 m | 55 to 65 | Subwoofer bands and ducts |
| Check | Formula Used | Pass Rule | Meaning In A Studio |
|---|---|---|---|
| Noise reduction | Source dB - corrected receiver dB | Higher is better | Raw isolation between rooms |
| Apparent TL | NR + 10 log10(S/A) | Used by contour | Area and room decay correction |
| Single deficiency | Contour dB - apparent TL | 8 dB maximum | Prevents one bad band from hiding |
| Total deficiency | Sum of all positive deficiencies | 32 dB maximum | Limits broad weak isolation |
| Final RIC | Highest passing contour - penalties | Compare to target | Practical room isolation estimate |
Room isolation is an process of preventing sound from moving from one room into another room. Room isolation is important to consider because sound can move through doors, through electrical outlets, and through the shared wall framing between buildings. A class are used to indicate whether the isolation barriers and seals in a room are performing their required function.
This class isnt just a number on a chart, but a way of determining whether the walls in that room and the volume of that room are performing as they should. Isolation is typically considered only when there is a sound problem in the room. For example, if the sound engineer knows that there will be a drum kit in the next room, or if the podcast guest is always in a busy lobby, isolation can be a concern.
Measuring and Fixing Room Sound Isolation
In these situations, sound engineer may begin to add mass to the walls to seal out sound from those next rooms. However, adding mass to walls does not necessarly fix all of the problems with sound movement through a structure. In these cases, each of the factors that influence sound movement in a structure should be measured to determine the true cause of the sound problem.
The calculator included in this article allows for each of these factors to be entered into the calculation. The dimensions of the room, the dimensions of the receiving room, the sound levels of each room, and the background noises in each of those rooms can be entered into the calculator to determine the level of sound absorption within each space. The Sabine relation can be used to calculate how long the sound will linger in the receiving room before it begin to fade.
This factor is considered in the calculation because the dead rooms will make a wall appear to have better isolation properties than a lively receiving room. Additionally, a flanking penalty and design margin can be added to the calculation to ensure that the calculation of sound isolation will not fail if some opening exists in the receiving room. Low frequencies can travel through the walls more easy than high frequencies.
Therefore, a wall that passes the sound levels at 1000 Hz may fail at 125 Hz. Calculations of the sound transmission loss of the wall can compare the loss of sound through the constructed wall to a reference contour of ideal sound isolation. Additionally, the largest drop in sound through one frequency band can be calculated, as well as the total drop in sound through all frequency bands.
If either of these factors drops below a given limit, the rating of the isolation of the constructed wall will drop. The target rating for a room can depend upon the use of that room. A voice booth may require less isolation than a room for drums.
This is due to the fact that speech contains more energy at higher frequencies than speech at lower frequencies, and sound energy decreases with frequency in speech. Conversely, a sound stage and a cinema may require higher rates of sound isolation due to the high levels of sound created in those spaces and the energy of those low frequencies. Preset buttons can load the dimensions of these spaces and the typical source profiles in each space.
The rooms that are constructed in real projects are rarely constructed like the example spaces in the calculation. Real projects may have floor joists that share walls between buildings, HVAC systems that allow sound to travel through walls, and sound may travel through shared electrical boxes between those projects. These factors can be accounted for with the flanking penalty in the calculation.
Furthermore, the sound levels within the room can be measured before any sealing work is performed in the construction, and after the work is performed. If the weakest band within the sound isolation calculations improves with the addition of a towel under the door, then the sound isolation in the construction was limited by sound leakage through that door. If the weakest band increases with the addition of a towel under the door, then that is the area where sealing work should be performed.
The volume of the room and the time for sound decay can alter the sound isolation calculation. Small sound booths that use sound absorbing materials will cause sound to decay rapidly. Large receiving rooms with hard surfaces will allow sound to linger in the room longer.
These factors are accounted for in the calculation of sound isolation, but the tool will only work with an honest measurement of the time for sound to decay in the receiving room. Any guesswork regarding the decay time will lead to an isolation rating that appears higher than the true sound isolation of the constructed walls. The reference tables within the article provide information that will allow sound engineers to remember the common sound isolation properties of various construction types.
For instance, single stud walls typically have poor sound isolation at frequencies below 250 Hz, but double stud walls have better isolation at low frequencies. The tables allow the sound engineer to remember these properties and to understand why low frequencies in one band may be lowering the sound isolation of the construction overall. The goal of the sound isolation calculation is not to produce a perfect score for the constructed walls.
Rather, the goal is to find a result that fits the use of the room and the budget for fixing any weakness in the sound isolation of the construction documents. The numbers can be entered with the measured sound levels, with the flanking and margin settings can be altered to account for the construction possibilities. Furthermore, if one frequency band is weaker than the others, that band indicates which construction effort will be most beneficial.
Thus, the calculation allows an understanding of the options for sound isolation, and which choice will lead to the next decision to be made by the sound engineer.