RC Curve Calculator
Rate room background noise from octave-band readings and check the spectrum balance for recording, practice, control, and performance spaces.
Calculation Breakdown
| Reported form | How this calculator derives it | What it usually means | Music-room response |
|---|---|---|---|
| RC 20(N) | 500, 1000, and 2000 Hz average near 20 dB | Quiet, balanced background | Strong fit for detailed recording |
| RC 30(R) | Low bands exceed the balanced contour | Rumble or mechanical low-frequency weight | Check HVAC paths, isolation, and fan speed |
| RC 25(H) | 2 kHz or 4 kHz bands sit above tolerance | Air noise, hiss, or grille turbulence | Check diffuser velocity and microphone noise floor |
| RC 35(RV) | Very high 31.5 Hz or 63 Hz content | Possible vibration or structure-borne energy | Confirm with slow averaging and tactile inspection |
| Band group | Formula role | Balance flag | Practical reading cue |
|---|---|---|---|
| 31.5 and 63 Hz | Low contour plus vibration screen | Rumble / vibration | May feel larger than it sounds |
| 125 and 250 Hz | Warmth and mechanical masking region | Low-frequency excess | Can blur bass instruments |
| 500 to 2000 Hz | Primary RC rating average | Core room criterion | Controls perceived speech-band noise |
| 4000 Hz | High-frequency balance check | Hiss | Often linked to airflow or electronics |
| Room type | Typical target | Preferred quality | Why it matters |
|---|---|---|---|
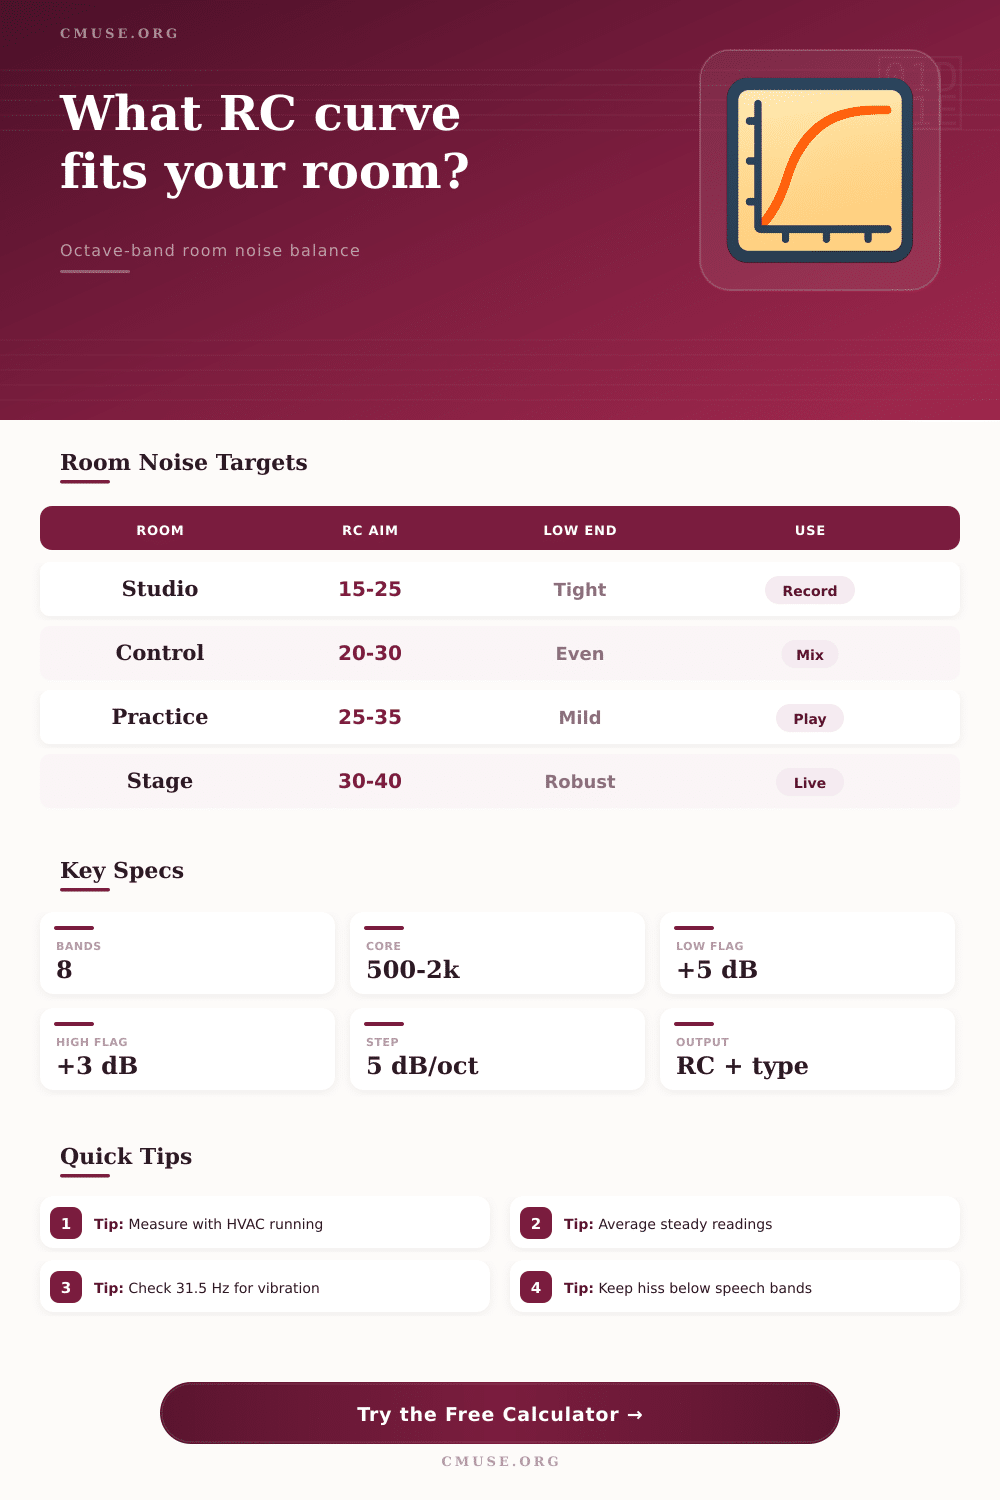
| Recording booth | RC 15-25 | Neutral | Keeps vocal and instrument tracks clean |
| Control room | RC 20-30 | Neutral or mildly warm | Protects mix detail without feeling unnatural |
| Practice room | RC 25-35 | Neutral | Allows teaching and rehearsal without strain |
| Performance stage | RC 30-40 | No vibration flag | Maintains usable background during quiet passages |
| Preset | Dimensions | Expected result | Secondary check |
|---|---|---|---|
| Home Studio 10x12 | 10 ft x 12 ft x 9 ft | RC 25(N) | Compact volume raises audibility |
| Recording Booth 5x5 | 5 ft x 5 ft x 8 ft | RC 18(N) | Low bands need confirmation |
| Stage Area 20x16 | 20 ft x 16 ft x 14 ft | RC 36(R) | Watch 63 Hz and 125 Hz |
| DJ Booth 6x4 | 6 ft x 4 ft x 8 ft | RC 32(H) | Check fan and electronics hiss |
Often present in a recording rooms even when the noise isnt being noticed, noise in the room becomes more noticeable when recording quiet vocals or piano passages. The type of noise that is often present in a room include HVAC rumble, fan hiss, and compressor noise, all of which can be present at levels below the level of human conversation. An RC curve rating is a single number that can be used to describe the noise level in a recording room, as well as the balance of the noise levels in the room.
You can calculate the RC curve rating with a few different methods, but the measurement of the noise in the room is a necessary step prior to determining the RC curve rating of the room, and ensuring that the individual understand what that number means. An RC curve rating can be determined by calculating the average noise level of the three middle speech bands, and then comparing all other noise measurements within the rooms frequency spectrum to a contour graph that features a decreasing slope as the frequency of the noise within the spectrum increase. If the levels of low-frequency noise within the room are measured as existing above the contour line of the graph, the room will receive an R (for rumble) designation within the RC curve rating.
How to Measure Room Noise with the RC Curve
If the levels of high-frequency noise within the room are measured as existing above the contour line of the graph, the room will receive an H (for hiss) designation within the RC curve rating. However, if the noise spectrum within the room is balanced, the room will receive an N (for neutral) designation within the RC curve rating. An RC 25(N) rating, for instance, indicates a different measurement of noise than an RC 25(R) rating.
Furthermore, the presence of rumble within a room with an RC 25(R) rating is often significant enough to mask the sound of bass instruments in that room, or even the vocals of the individual performing in that room. The target RC curve value for a room often depends upon the type of room that is being measured. For instance, the RC curve rating for a vocal booth should be lower than the RC curve rating for a live rehearsal room, as the vocal booth must be quiet enough to ensure that the vocals of the individual are not reflected off the walls of the booth.
However, the control room can have an RC curve rating that is greater than that of a vocal booth but less than the rating required of a live rehearsal room, as the control room should be able to allow engineers to hear the details of the vocals and instruments being played in that room, yet still allow the engineers to avoid becoming distracted by the background noise in that room. Each of these different types of rooms can be accounted for with an RC room noise calculator by selecting the type of room that is to be measured. Room noise measurements that are excellent for vocal booths may be marginal for other types of room.
In addition to the type of room that is to be measured, there are a few conditions under which the noise within a room should be measured. For instance, the HVAC systems in the rooms should be running at their normal speed, as the noise created by those systems should be reflected within the noise measurements of the room. Furthermore, a few samples of noise should be taken within the room, and each of those samples should be averaged to determine the noise measurements of the room.
In addition to this, the 31.5 Hz band of noise in the room should be measured separately from the remaining measurements of the room, as this frequency band can reveal different types of noise from the remainder of the noise measurements. These conditions will impact the interpretation of the noise measurements of a room, but not the calculation of the measurements themselves. In addition to the single noise measurement of a room that is represented by the RC curve rating, the balance of the noise spectrum within that room is often more important than the number represented by the RC curve rating.
An RC curve rating of 30 with a balanced noise spectrum within the room may be better for certain types of work within that room than an RC 22 rating with an uneven spectrum of noise within that room. Therefore, the calculation of the slope of the noise spectrum within the room can help an engineer to determine whether the fans within a recording room should be adjusted to create a more even spectrum of noise, or if silencers should be added to the room to reduce the evenness of that noise spectrum. Often, the noise levels within a real room will differ from those measured with a textbook approach to calculating the noise within that room.
For instance, the addition of room furnitures, diffusers, or even the position of the microphone within a room can impact the noise that is measured with the room. To account for these small differences, an RC room noise calculator may allow engineers to select a tolerance level for the noise measurements within the room, which would ensure that small differences in the noise within the room would not impact the RC curve rating of the room. Furthermore, an RC curve rating of a room is only a single snapshot of that rooms noise at a given time.
To account for changes to the mechanical systems that create much of the noise within the room, those noise measurements would need to be repeated after any changes to the mechanical systems within that room to determine if the changes to those systems has led to the improved RC curve rating of the room. A low RC curve rating to a room is not always to be preferred to a higher rating. For instance, a very quiet room that often includes rumble within its noise spectrum may have an RC curve rating that is lower than a room with a high level of noise, yet which has a balanced noise spectrum within the room.
An RC curve rating and a label that indicates the balance of the noise spectrum within a room are both displayed on the calculator simultaneously, which allows engineers to make a decision regarding the level of noise within the room. Once engineers have gained an understanding of the RC curve rating of their recording rooms, the engineers may use those measurements to determine how best to match the noise level of a room to the types of work that will occur within that room.