PSR Calculator
Compare peak-to-short-term ratio, peak-to-loudness ratio, true peak margin, codec headroom, and target trim for masters, podcasts, broadcast segments, voice spots, and game audio.
Load a realistic audio case. Presets set the delivery target, measured LUFS values, true peak, codec allowance, and practical minimum PSR for the chosen format.
Short-Term PSR
Compares the highest true peak to the loudest 3 second short-term loudness.
PSR = true peak - short-term LUFS
Integrated PLR
Compares true peak with the integrated loudness of the complete program.
PLR = true peak - integrated LUFS
Delivery Headroom
Subtracts true peak and codec allowance from the selected peak limit.
margin = limit - peak - codec
Target Trim
Estimates loudness gain and projects the true peak after that gain move.
trim = target - integrated
Full Calculation Breakdown
Short-term loudness window
Momentary loudness window
True peak reference unit
Loudness reference unit
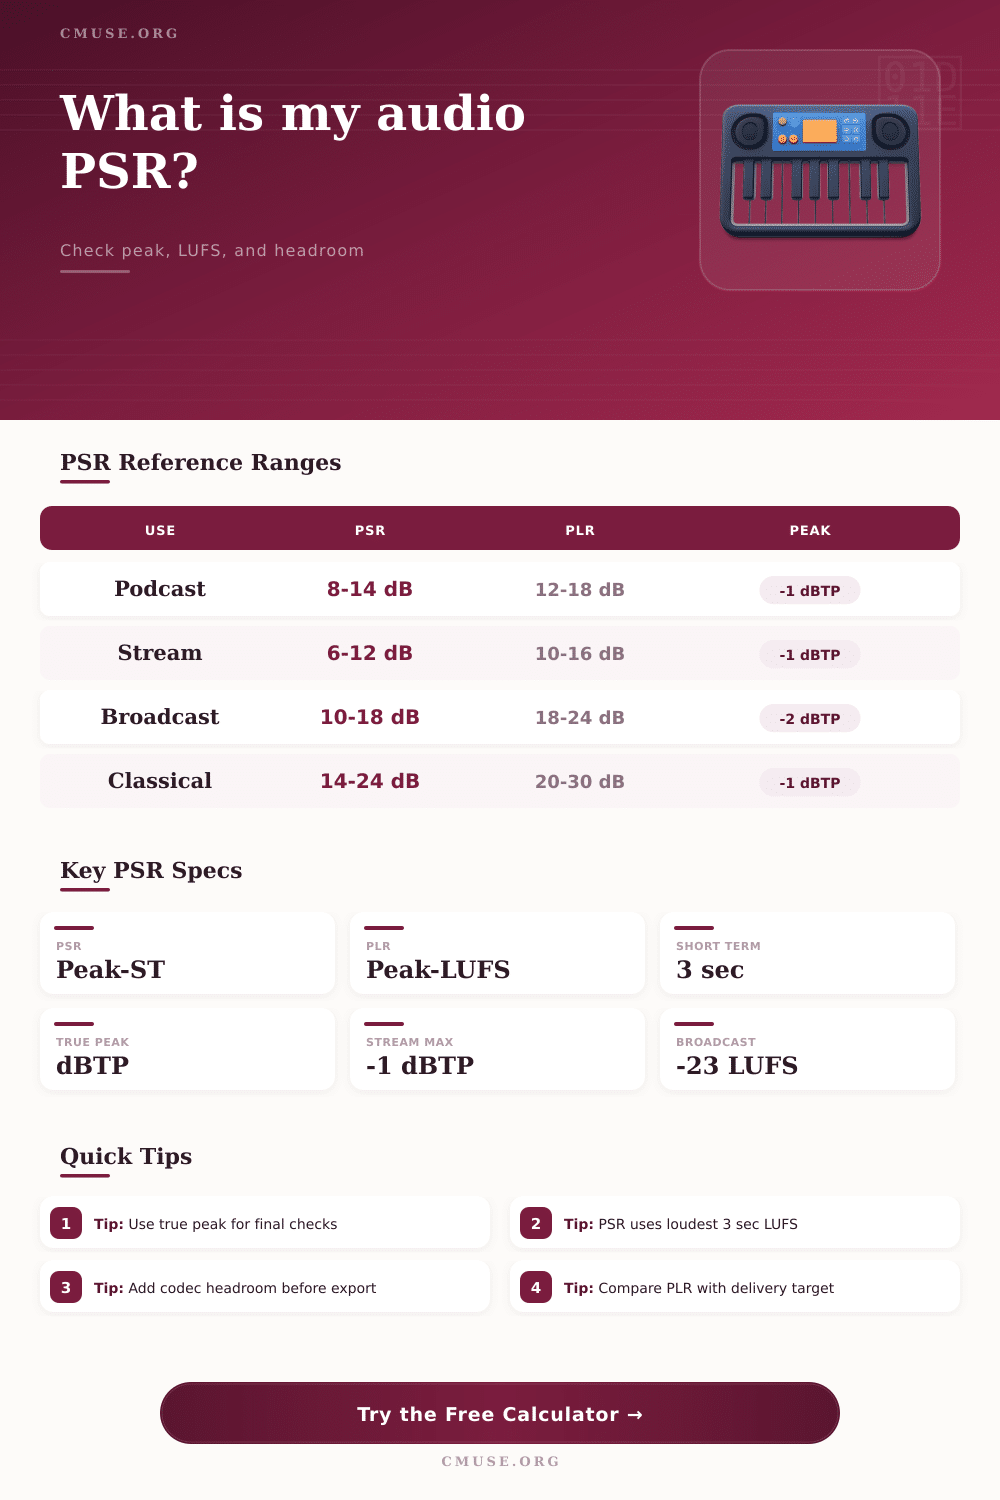
| Audio Type | Useful PSR Range | Useful PLR Range | Common Target | Reading To Trust |
|---|---|---|---|---|
| Streaming pop or rock master | 6 to 12 dB | 10 to 16 dB | -14 LUFS reference, -1 dBTP ceiling | Loudest chorus short-term value |
| Podcast or dialog program | 8 to 14 dB | 12 to 18 dB | -16 LUFS stereo or -19 LUFS mono | Speech-heavy sections without long pauses |
| Broadcast program segment | 10 to 18 dB | 18 to 24 dB | -23 or -24 LUFS style delivery | Full act, complete segment, or full show |
| Classical, jazz, or acoustic music | 12 to 24 dB | 18 to 30 dB | Project dependent, peak margin prioritized | Complete movement or representative passage |
| Club or loud promotional master | 4 to 8 dB | 7 to 12 dB | Often louder than normalization reference | True peak plus audible distortion check |
| Profile | Default Target | Peak Limit | Codec Allowance | PSR Guide |
|---|---|---|---|---|
| Streaming music reference | -14 LUFS | -1.0 dBTP | 0.5 dB | 8 dB or more keeps room for transients |
| Podcast speech delivery | -16 LUFS | -1.0 dBTP | 0.3 dB | 9 dB or more helps consonants stay clean |
| Broadcast program check | -23 LUFS | -2.0 dBTP | 0.2 dB | 12 dB or more suits dialog and music beds |
| Film or trailer stem | -24 LUFS | -2.0 dBTP | 0.2 dB | 12 dB or more leaves impact headroom |
| Game cinematic mix | -18 LUFS | -1.0 dBTP | 0.5 dB | 10 dB or more balances dialog and effects |
| Condition | Likely Reading | Meaning | Check Next | Status Cue |
|---|---|---|---|---|
| Low PSR, normal PLR | Short-term peak gap is small | Loud section is dense or limited hard | Loudest chorus or effect cluster | Punch risk |
| Normal PSR, low PLR | Whole file is close to the peak ceiling | Average level may be too hot | Integrated LUFS versus target | Trim risk |
| Good ratios, poor margin | True peak is near or above the limit | Loudness shape is fine, ceiling is tight | Codec preview and limiter ceiling | Peak risk |
| High PSR, high PLR | Large gap from loudness to peak | Dynamic or very transient material | Audibility of stray peaks | Dynamic |
| Project | Typical Loudness | Typical Peak | Expected PSR | Secondary Check |
|---|---|---|---|---|
| Modern streaming single | -14 to -10 LUFS integrated | -1.0 dBTP | 6 to 11 dB | Lossy encode overs after normalization |
| Interview podcast episode | -19 to -16 LUFS integrated | -2 to -1 dBTP | 8 to 14 dB | Guest level jumps in short-term meter |
| TV documentary act | -24 to -23 LUFS integrated | -2 dBTP or lower | 10 to 18 dB | Music bed against dialog anchor |
| Classical live capture | -24 to -18 LUFS integrated | -3 to -1 dBTP | 14 to 24 dB | Single applause or percussion peaks |
| Game cinematic scene | -20 to -16 LUFS integrated | -2 to -1 dBTP | 9 to 16 dB | Effects bursts over dialog lines |
Anyone who’s mixed anything knows what I’m talking about: That moment in the studio where your mix sounds HUGE and then you put it out on your phone and it goes “poof”. 99% of the time, it’s a loudness war run amok. You’ve crunched down your dynamics so hard that all energy dissapears from your monitors.
The PSR calculator provides practical checks for integrated PLR (which look at the full program), Peak To Short Term Ratio, True Peak Headroom, Codec Margin and Loudness Trim. These is measurements to close the gap between mixing and how people hear it. While most engineers only obsess over LUFS because streaming services require them to hit a certain target, they neglect that perceived level is only half the story. Dynamic range make up the other half and that’s precisely what PSR does.
Why Your Mix Sounds Different on Your Phone
It compares your absolute true peak to your loudest short-term section. What is PSR? Think of it like air between you and the ceiling in an enclosed space. If you have plenty of headroom (high ratio), you are probably going for punchy-sounding mixes. On the other hand, if you have a low ratio, it may be because you are mixing naturaly dense music or simply limiting heavily.
Once you measure your values and plug them into the calculator above, it do the rest of the math for you. Gone is the guessing game of whether or not your mastering chain is pushing things too hard.
Here’s why you want it: Digital streaming services normalize audio anyway. This means your mix with more dynamic range will typically sound louder after normalization than a mix that has been artificialy boosted before export. The built-in PLR works the same way, except now it measure the maximum throughout the entire piece rather than just the loudest three seconds. That’s important if you’re working on something long-form where consistency matter more than momentary punch. In those cases, when consistency is more important than punchiness, PLR helps you know how far away from clipping you are based off the entire piece. If you’ve got limited PLR, your entire track may be dangerously near to clipping.
And since lossy codecs like Ogg Vorbis or MP3 has the potential to add inter-sample peaks above your true peak level, they could cause distortion that’s imperceptible within the higher-res original. Giving yourself some codec leeway in your workflow protects against this unseen harm, while also ensuring your final product stays squeaky-clean despite any compression.
These figures vary according to genre. For example, a contemporary pop song can sit comfortabley with a PSR of six to twelve decibels while retaining sufficient transients to punch through the mix without being too loud. Live jazz or classical recordings frequently need upwards of twenty decibels PSR, maintaining the dynamic nature of original performances. Pumping up a classical recording with a pop-style loudness profile is simply asking for trouble. It will squash all the subtleties that make it compelling.
The chart below, on this page, makes this clear and demonstrates just how different broadcast standards are from what is needed for club readiness. Tread carefully, you should of not use the same limiting approach for everything. Engineers often make this mistake, believing that sample peaks are equivalent to true peaks. Sample peak values does not account for what happens between digital samples. You can still have clipping occur when converting formats or up-sampling audio. When mastering the audio you are delivering, always rely on a true peak meter to show accurately what’s going on.
A second trap is to only pay attention to the integrated value and ignore the short-term loudness measure completely. The short term lets you know how punchy a particular moment sounds… Whether it is the burst of dialog or the drop into a chorus. That moment will sound flat even if the overall average is high if there isn’t any dynamic headroom in that moment.
The takeaway here is, these are tools for making informed decisions, not a hunt for random numbers. Your music need to work on all your devices, so you need a blend of dynamics and loudness appropriate for the material. Make your adjustments, check your peaks, be mindful of codec limits, then give it another listen with new ears. It’s not just about meeting a technical spec; it’s about making sure the emotion you felt while mixing still comes through at the end of the chain, from your studio to someone’s speakers. If you do that, the mix breathes easily, connecting with an audience without fatiguing them, while retaining the details along the way. And that’s where pros live in the balance, behind some simple math any one of us can perform.