Peak to Average Ratio Calculator
Turn peak and RMS levels into crest factor in dB, a linear PAPR ratio and a dynamics rating – or work backwards from crest factor to find the missing peak or RMS
Full Calculation Breakdown
| Waveform / Source | Crest Factor | Amplitude Ratio | Character |
|---|---|---|---|
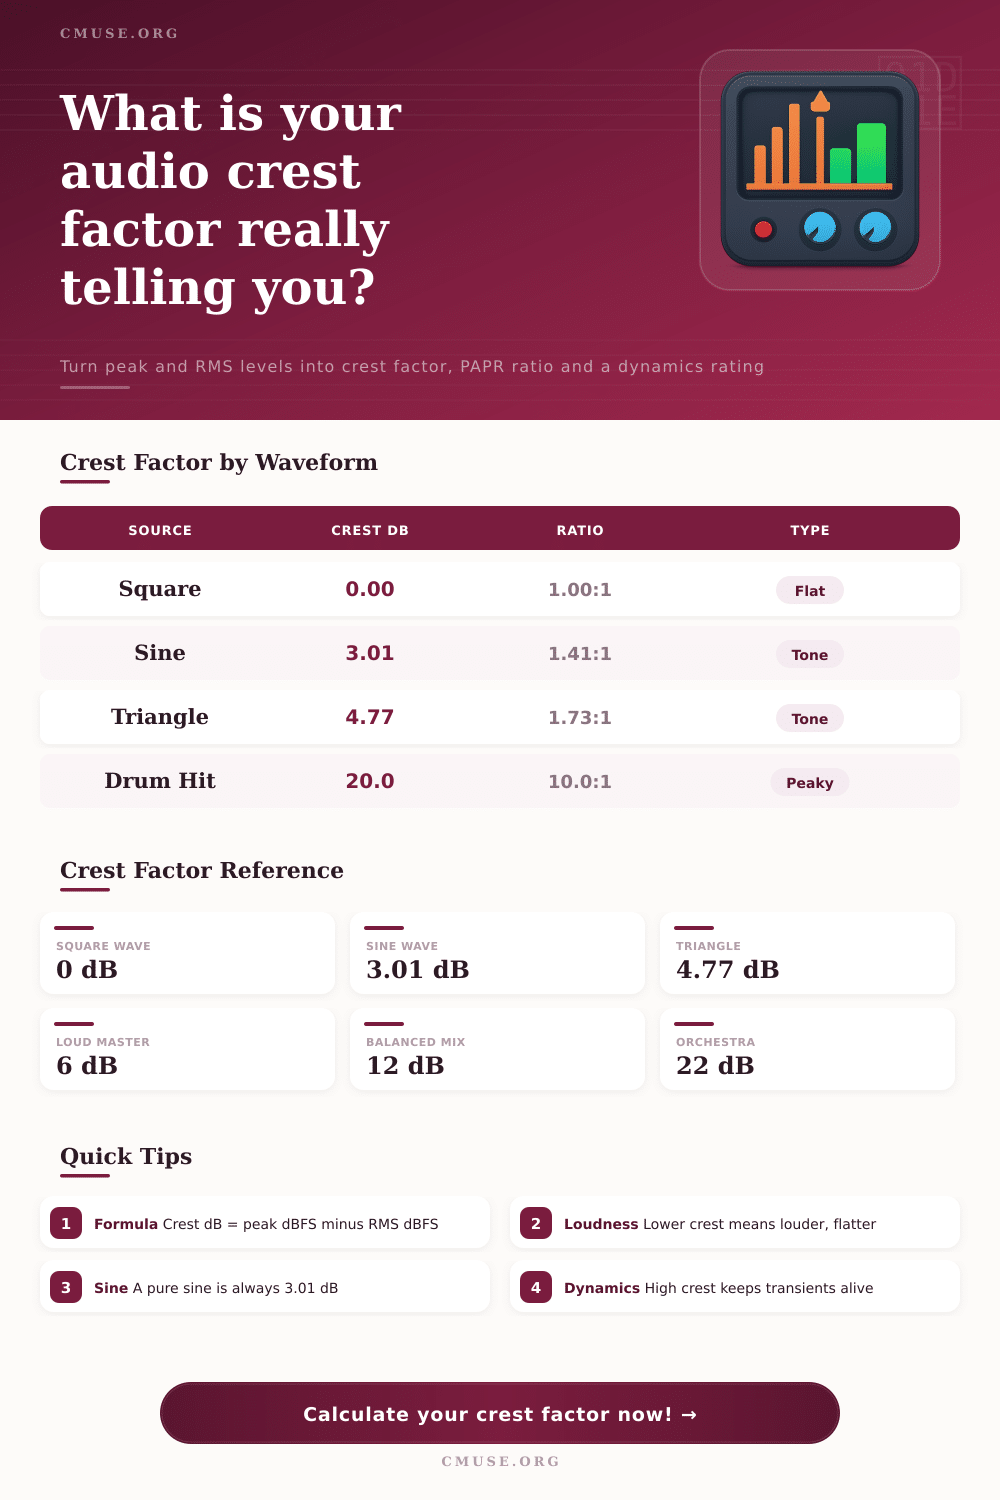
| Square wave | 0.00 dB | 1.00 : 1 | Maximally flat |
| Sine wave | 3.01 dB | 1.41 : 1 | Pure tone |
| Triangle wave | 4.77 dB | 1.73 : 1 | Smooth tone |
| Sawtooth wave | 4.77 dB | 1.73 : 1 | Bright tone |
| Pink noise | ~12 dB | ~3.98 : 1 | Natural spread |
| Single drum hit | ~20 dB | 10.0 : 1 | Very peaky |
| Crest Factor (dB) | Amplitude 10^(dB/20) | Power 10^(dB/10) | As X : 1 |
|---|---|---|---|
| 0 dB | 1.00 | 1.00 | 1.00 : 1 |
| 3.01 dB | 1.41 | 2.00 | 1.41 : 1 |
| 6 dB | 2.00 | 3.98 | 2.00 : 1 |
| 12 dB | 3.98 | 15.85 | 3.98 : 1 |
| 18 dB | 7.94 | 63.10 | 7.94 : 1 |
| 20 dB | 10.00 | 100.0 | 10.0 : 1 |
| Material / Master | Typical Crest | PAPR | Dynamics Rating |
|---|---|---|---|
| Brick-walled loudness | 3–5 dB | ~1.5–1.8 : 1 | Very loud / flat |
| Loud streaming master | 6–8 dB | ~2–2.5 : 1 | Loud |
| Balanced pop / rock mix | 10–13 dB | ~3–4.5 : 1 | Balanced |
| Dynamic acoustic / jazz | 14–18 dB | ~5–8 : 1 | Dynamic |
| Classical / orchestra | 18–24 dB | ~8–16 : 1 | Very dynamic |
Even though you’ve hit your loudness targets, sometimes a song sounds like it’s been squashed. The vocals sits on top of everything else, and you find the kick drum sounding distant. Although you’re at the right volume levels, there isn’t much going on in the mix.
In this case, it’s typically because the difference between the average energy level of the signal and its peak levels is too small. That distance is known as crest factor and tells us more about how the mix sounds than just volume level. To explain the ratio, you need to break it down between RMS (root mean square) measures and peak level.
What is Crest Factor?
Peak level represent the maximum height of the waveform at any given moment. When that needle peaks to zero decibel full scale, you’ve hit the roof. Any further and you are distorting which is called clipping. RMS, on the other hand, represents average power of sound during a specific period of time. Your ear perceives what’s going on based off sustained energy rather than a quick spike, making RMS a better indicator of relative loudness.
To put both of those values into one number, we have a crest factor, measured in decibels, which is where the calculator on this page comes in. From there, you’ll know exactly just how dynamic your source material might be.
For an analogy think of a mountain range compared to a flat plain. The crest factor of a square wave is zero decibels. It has no peaks compared to its average height. It’s harsh sounding because there is nothing for the ear to follow. At the other end of the spectrum you have a pure sine wave that comes in around three decibels. It is smooth but lacks texture.
And then we come to most moddern pop mixes, which aim to achieve anything from six to ten decibels. That gives enough headroom to allow for both the peaks (the punchiness of the transients) and competitive average loudness levels. If you push harder to get more of the RMS you squash down those peaks. They reduce their crest factor until the track lose its life.
On the page, there are also some reference tables for various genres. Dynamics are a feature of orchestral music, meaning range of the possible crest factor could be as many as 20 or more decibels. In contrast, when mastering for streaming, a highly compressed mix might have a crest factor as low as six decibels to sound as loud as possible on smaller speakers. Neither solution is right nor wrong, it just depends on what you want your final product to do.
Do you wish to have an audio mix with maximum impact and transparency? Or do you want one with pure volume density? You can plug in your RMS value and peak into the tool to find out how your mix aligns different than these standards.
And then there’s the linear ratio to consider in addition to the db figure. A 12db crest factor equals approximately a 4:1 amplitude ratio. Your peak levels is going to be around four times greater than your average signal level. Knowing that this is a multiplicative relationship is key when you’re encountering digital headroom limitations or analog gear.
You can avoid being surprised by your preamps suddenly clipping if you know how much voltage swing your peaks require, so you do not go past their threshold. It turns something abstract, like a dB number, into something concrete, a physical need for your chain of gear.
A lot of engineers run after loudness at the expense of dynamics. The waveform appears as a solid brick when viewed on your screen. They have compressed it until the RMS increases, but the crest factor dissapears. And that’s where we often end up with something that makes listeners tired instead of excited.
Your ears are wired for change in energy. If you remove that change by making average and peak levels converge then the music no longer engages you emotionally. It’s just background noise, not a focal point.
If you know what these numbers are then you can regularly check them without going overboard with compression on your mix. It doesn’t require an expensive piece of kit either. Digital metering that shows Peak and RMS levels is simple enough to get hold of. Then there are software tools that you can use to calculate it accurately.
The point is awareness. Understanding that a three-decibel difference sounds flat while a twelve-decibel difference feels balanced means you have a solid target in mind when mixing. It moves you away from simply making things louder to shaping the relationship between the transient and sustain. A good mix honors average level while paying tribute to the peak as well. Your bass rumbles and your drum snaps without trading one off against the other.
Pushing your sound for volume while monitoring crest factor preserves the natural shape of your audio. Crest factor maintains a dynamic range that is clear instead of flattening out the landscape. The ability to hear transients cutting through the mix shows you have found the proper balance between dynamics and power, it would of been better if you checked first.