Octave Band Sound Pressure Level Calculator
Enter octave-band SPL values, project them to the listener position, apply A, C, or Z weighting, find the dominant band, and compare the spectrum against common audio and noise references.
🎧Named Noise Spectrum Presets
📏Measurement and Projection Inputs
📊Octave Band Levels at Reference Distance
Band-by-band calculation breakdown
| Band | Input SPL | Projected SPL | Weighting | Weighted band | Energy share |
|---|
🎵Current Spectrum Snapshot
📝Weighting and Spectrum Comparison Grid
📊A and C Weighting Reference Table
| Octave band | A weighting dB | C weighting dB | Typical audio clue |
|---|---|---|---|
| 31.5 Hz | -39.4 | -3.0 | Sub rumble, HVAC vibration, stage floor energy |
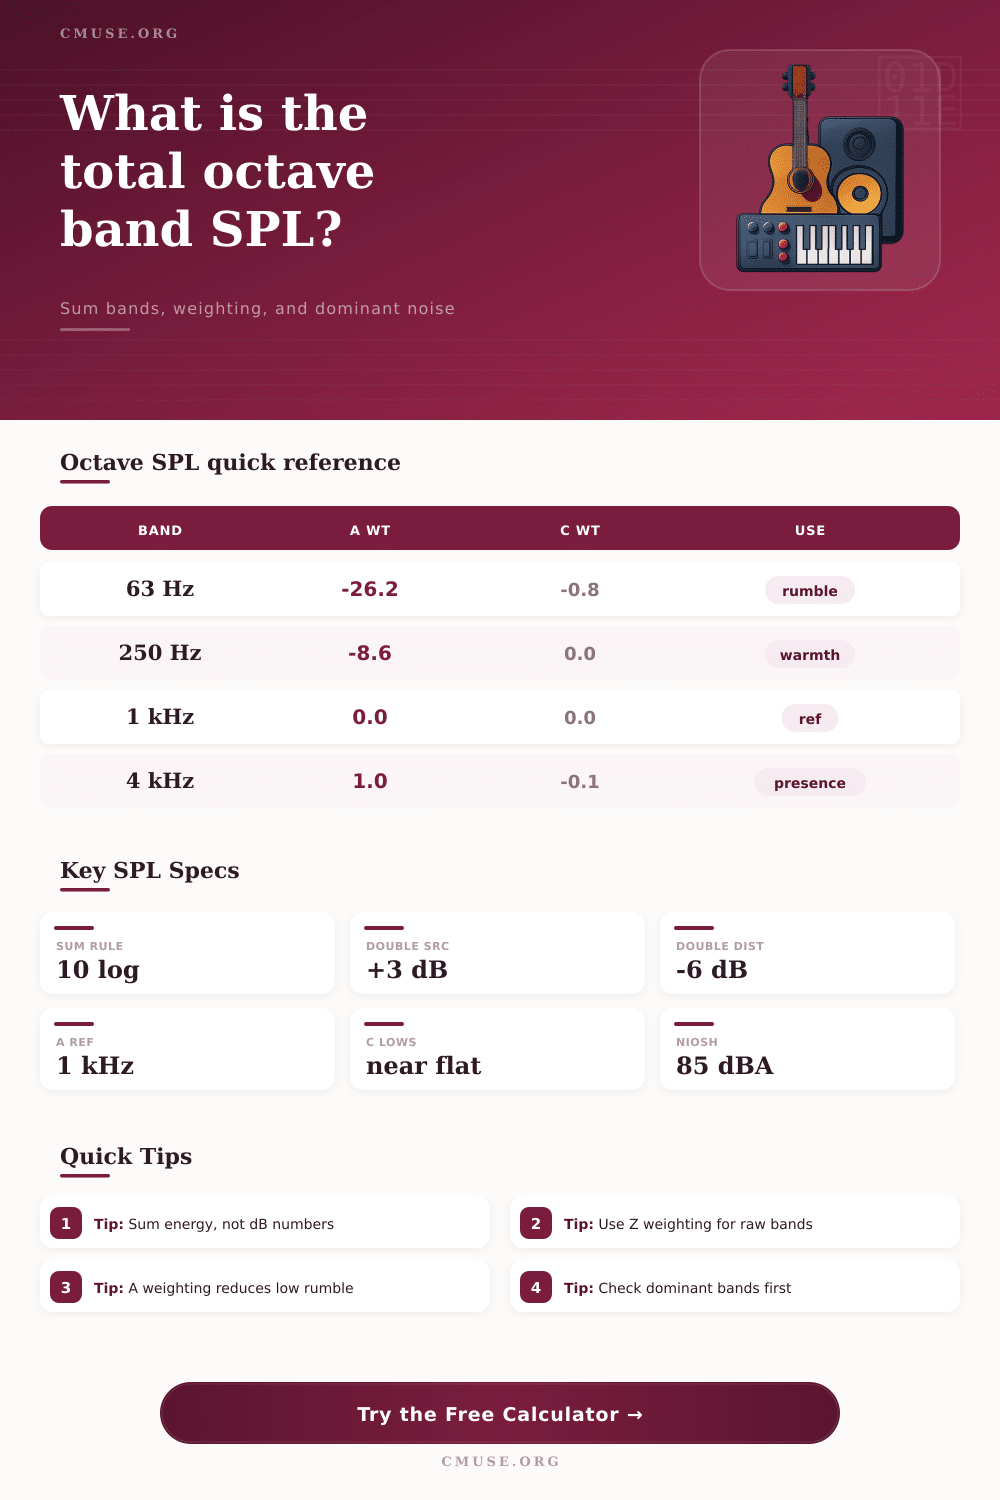
| 63 Hz | -26.2 | -0.8 | Traffic rumble, kick drum weight, room boom |
| 125 Hz | -16.1 | -0.2 | Bass warmth, fan hum, male voice chest |
| 250 Hz | -8.6 | 0.0 | Low-mid buildup and boxiness |
| 500 Hz | -3.2 | 0.0 | Midrange body and room tone |
| 1 kHz | 0.0 | 0.0 | Reference band for speech and calibration |
| 2 kHz | +1.2 | -0.2 | Speech intelligibility and instrument clarity |
| 4 kHz | +1.0 | -0.1 | Presence, bite, fatigue-sensitive band |
| 8 kHz | -1.1 | -0.8 | Air, hiss, cymbal edge, sibilance |
| 16 kHz | -6.6 | -3.0 | Top octave air and analyzer noise |
🔍Band Role and Diagnostic Table
| Band range | Music or audio role | Common problem source | First check |
|---|---|---|---|
| 31.5 to 63 Hz | Sub bass, physical impact, very low rumble | HVAC vibration, traffic, subwoofer coupling | Boundary loading, isolation, C weighted view |
| 125 to 250 Hz | Bass warmth, low-mid weight, modal pressure | Room modes, cabinet resonance, stage bleed | Position, trapping, source distance |
| 500 Hz to 1 kHz | Core midrange, speech body, tuning reference | Boxiness, small-room reflections, fan broadband | Absorption, speaker aiming, room correction |
| 2 to 4 kHz | Definition, vocal edge, attack, intelligibility | Harsh PA, reflective surfaces, close instruments | Directivity, EQ, exposure time |
| 8 to 16 kHz | Air, hiss, cymbal sheen, top-octave detail | Electronics hiss, leaks, high-frequency reflections | Noise floor, sealing, analyzer bandwidth |
📐Common Spectrum Preset Reference
| Preset | Dominant region | Expected weighting behavior | Best use |
|---|---|---|---|
| Studio HVAC | 63 to 250 Hz | A weighting hides much of the rumble | Control-room noise checks |
| Control Room Pink | Broadband | A and Z stay closer through the mids | Monitor and analyzer sanity checks |
| Venue PA Check | 63 Hz to 4 kHz | C weighting reveals more low-end energy | Audience SPL and tonal balance |
| Traffic Outside | 31.5 to 125 Hz | A weighted total drops sharply | Isolation and facade leakage |
| Machine Room | 125 Hz to 1 kHz | A weighting still reports substantial energy | Equipment-room noise screening |
🧮Logarithmic Summation Rules
| Situation | Approx result | Formula idea | Practical meaning |
|---|---|---|---|
| Two equal bands or sources | +3.0 dB | 10 log10(2) | Energy doubles, loudness does not simply double |
| Four equal sources | +6.0 dB | 10 log10(4) | Useful for stacked speakers or multiple machines |
| 10 dB louder band | About +0.4 dB | Dominant energy controls sum | Quiet bands barely change the total |
| Double distance free-field | -6.0 dB | 20 log10(r1/r2) | Direct sound falls quickly with distance |
| Background plus source | Energy sum | 10 log10(a+b) | Subtract background before rating a source when possible |
When measuring sounds in a room, teh loudest sounds in that room will eventually become apparent to a listener who is attending to the sounds in that room. This is the reason for the use of octave band sound pressure level calculations. Each band of sound contribute to the total sound energy that is radiated from a sound source.
The energy that each band contributes determine the total sound that is created by that source, and the total sound energy determine the actions that must be taken in response to that sound. In order to calculate total sound energy, it is first necessary to incorporate a specific rule regarding sound levels. Sound levels in decibels cannot be simply added to one another; each unit of decibel represent a logarithmic measurement of energy.
Measuring Sound in a Room
For instance, if two sound source of identical energy are combined, the total level of sound will increase by three decibel; four identical sources will increase the sound level by six decibels. The inclusion of this calculation is important for predicting the sound that will be heard in a space, or to determine if a space will meet certain limits regarding noise. Thus, the calculator performs this calculation for the entered values of each band of sound.
In addition to performing simple summation of each band of sound, weighting curves can be employed to provide a more accurate representation of the sound that is radiated by a source. Weighting curves are created based off the way in which human hearing perceives sound of moderate levels. Very low frequency are often reduced in contribution to the sound level measurement; C weighting is used when an evaluation of physical vibration is to be performed, for instance.
Z weighting calculates the sound levels without application of any weighting. Each weighting curve is used instead of another in response to the question that is being asked of the sound; A weighting is used for speech, C weighting for vibration analysis. Distance from sound sources and the number of sound source within a given space will affect sound levels within that space.
Sound levels will decrease as the distance between a sound source and the listener increases; however, in rooms with reflections, those sound levels will be lessened in relation to the open-air calculation. Additionally, adding similar sound sources will increase the total sound level in relation to the energy of each individual sound source; three identical sound sources will not have three times the energy of one sound source. The inputs for this calculation will account for these factor.
In addition to calculating the total sound within a space, it is also possible to determine the dominant band of sound. The bands of sound are summed to calculate the total sound level within a space; the band with the highest level will be the dominant band. This band will often be the first targeted with any sound treatment; however, it isnt guaranteed to be the loudest sound within that space.
Low frequencies can travel through the structure within a space; high frequencies can cause listener fatigue. Thus, the dominant band is not the only band that may be treated in a space; however, it is often the starting point for any treatments. The rooms that are evaluated are rarely textbook rooms.
Real rooms often have background noise within them; background noise from outside the space, or from other sources within the space. That background noise will increase the total sound level that is measured within a space. The background field can be entered into the calculator to determine how much of an effect this has upon the total sound level within a space.
Thus, it is important to know if the space is quiet or loud; this changes the type of fix that must be performed. Similar to the exposure tables, the exposure estimates are created using the same logic; they are based upon the relationship of the sound level measurements to certain guidelines. The dose is not a legal limit to sound exposure, but it is a measurement of the relationship between the sound level measurements and the guidelines.
Short periods of high sound levels will contribute to the same dose as long periods of moderate levels; the exchange rate between dose and level will change the relationship between the measurement and the dose. Thus, the calculator allows individuals to compare these levels to determine which reference is appropriate for the situation. The reference tables within this document are used to translate the numbers into language of the room.
Sound bands labeled presence and air, for instance, refer to types of sound that can be introduced into the space. Bands of sound labeled rumble or warmth refer to physical vibrations that may be reduced within the space. Thus, the reference tables allow individuals to recognize each band of sound and the changes that may be made to that band.
This entire calculation is most useful in the comparison of sound levels before and after some change is made to a space. In order to effectively use these calculations, sound levels should be measured while the sound source is running, some change should be made, and then sound levels should be measured again. The change in the total sound levels and the change in the dominant band will reveal if the change that was made to the space was effective.
Without performing such a measurement, treatments can be purchased that will not fix the problem that is experienced. The way in which the calculations are performed is also important to the usefulness of these calculations. The microphone should remain at ear height, or the height of the individual that are to use the space.
The same length of integration time should be used for each sound level measurement; sound level measurements may be taken at different times, but they should be of the same length. It is also important to note the level of background noise within the space, should any exist; this level can be subtracted from total sound level measurements to arrive at sound levels of just the source that is being evaluated.