NR Curve Calculator
Match octave-band sound pressure levels to Noise Rating curves, identify the controlling band, and compare each band against a target NR limit.
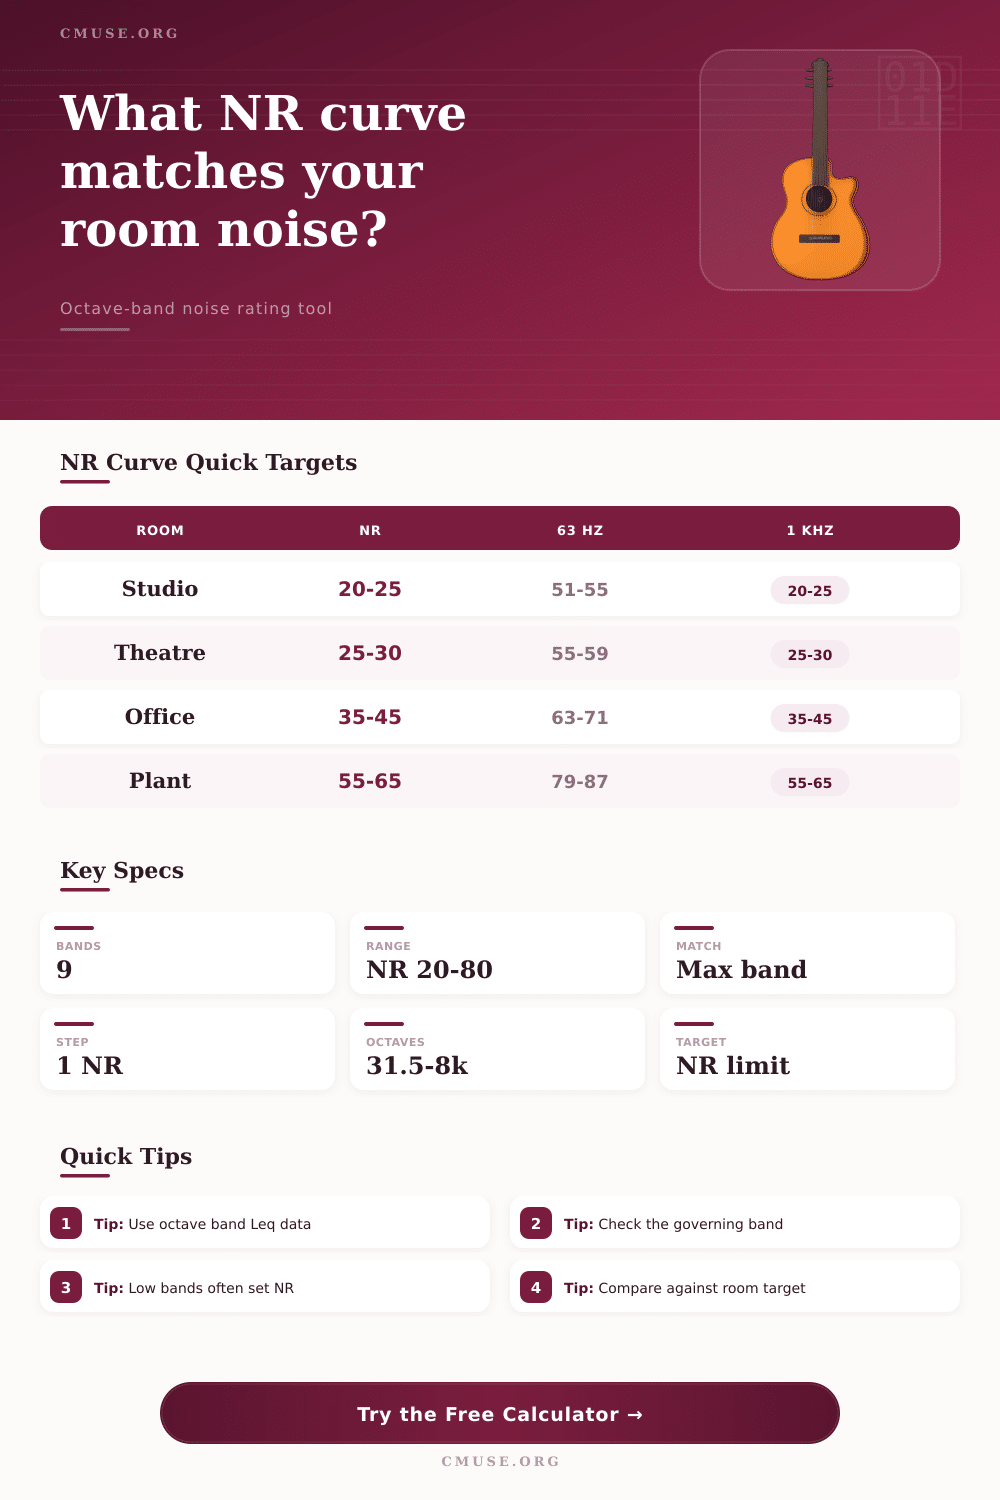
Enter linear octave-band sound pressure levels in dB. The calculator compares each band to interpolated NR reference curves and uses the highest required band as the room rating.
Common NR Targets
| Use Case | Typical Target | Acoustic Intent | Critical Check |
|---|---|---|---|
| Broadcast studio | NR 20-25 | Low speech noise floor | HVAC and low bands |
| Recording booth | NR 20-25 | Clean capture | 63 Hz to 250 Hz |
| Theatre or cinema | NR 25-30 | Quiet audience room | 500 Hz speech band |
| Classroom | NR 30-35 | Clear instruction | 125 Hz rumble |
| Open office | NR 40-45 | Background tolerance | 2 kHz hiss |
Selected NR Curve Limits (dB SPL)
| NR Curve | 31.5 Hz | 63 Hz | 125 Hz | 250 Hz | 500 Hz | 1 kHz | 2 kHz | 4 kHz | 8 kHz |
|---|---|---|---|---|---|---|---|---|---|
| NR 20 | 69.0 | 51.2 | 39.4 | 30.6 | 23.4 | 20.0 | 16.8 | 14.4 | 12.6 |
| NR 30 | 75.7 | 59.2 | 48.2 | 40.0 | 33.8 | 30.0 | 27.0 | 24.5 | 22.9 |
| NR 40 | 82.4 | 67.1 | 56.9 | 49.4 | 44.2 | 40.0 | 37.2 | 34.7 | 33.2 |
| NR 50 | 89.5 | 74.9 | 65.5 | 58.5 | 51.3 | 50.0 | 47.3 | 45.2 | 43.5 |
| NR 60 | 96.3 | 82.8 | 74.2 | 67.9 | 62.5 | 60.0 | 57.4 | 55.3 | 53.8 |
Curve Matching Formula Guide
| Step | Formula | What It Means | Result Used |
|---|---|---|---|
| Band limit | L(f, NR) | Interpolated NR curve limit for one octave band | Target dB at band |
| Band rating | NRf = inverse L | Curve required so the measured band does not exceed it | Per-band NR |
| Room rating | NR = max(NRf) | The highest band requirement controls the final rating | Matched NR |
| Overall SPL | 10 log10 sum 10^(L/10) | Energy sum of the entered octave-band levels | Reference dB |
Preset Spectra Summary
| Preset | Target | Likely Limiter | Typical Use |
|---|---|---|---|
| Broadcast studio | NR 20 | 63 Hz services | Speech recording |
| Control room | NR 25 | 125 Hz air noise | Mix decisions |
| Theatre | NR 30 | 500 Hz background | Audience playback |
| Rehearsal room | NR 50 | 2 kHz activity | Active music room |
| Plant room | NR 65 | 31.5 Hz rumble | Mechanical services |
Noise rating curves exists because a single figure for decibels do not always allow for a full description of the noise in a given room. Two rooms may have the same measurement of 45 dB(A), but one room may be too loud for speech recording, while the other may be an acceptable level of noise for an office that is to be expected to fill with many employee. These differences between the two rooms with the same decibel measurement are due to the different distribution of energy within the rooms.
Noise rating curves uses octave-band analysis to determine the energy of the noise within a given space. The audible spectrum is divided into nine center frequencies that range from 31.5 Hz to 8,000 Hz. Low-frequency bands will pick up on the rumble created by equipment like HVAC fans, while the middle bands will carries the energy created by speech.
How noise rating curves help with room noise
High-frequency bands will reveal any hiss created from electronic equipment within the room. Each of the nine measured level will produce a single curve containing each of the measured values. The highest value of required decibels within a band becomes the noise rating for that space.
The single-number noise rating is helpful because it forces a decision regarding the noise level of a space. If a space is to be rated as having an NR of 25, for instance, it is impossible to have one band of noise level above 30 dB(A). The governing band is the band that creates the decision of whether a space pass or fails an acceptance test.
For instance, many mechanical rooms will have the majority of their energy within the 63 Hz or 125 Hz bands due to the fans that exist within those rooms. The low-frequency energy within a space might also create problems in reaching an NR of 20. The single-number noise rating allows for the identification of the governing band within a space.
There are room targets for different type of spaces. For instance, a room that is to be used for speech recording will have different noise level requirements than an office. More specifically, an office may be able to stand higher levels of noise than a recording room.
The same is true of a theatre, where the audience should not be aware of the HVAC system within the venue. The HVAC system, however, must be strong enough to provide comfort to the audience members. These targets are created based off speech intelligibility studies of these types of rooms.
The margin setting allow for the incorporation of a safety factor into the measurements. For instance, adding a margin of 0.5 dB will change which bands of noise are found to be within acceptable levels of a target noise rating. This type of margin account for inherent issues within the measurement of noise.
For instance, sound level meters cannot always be set to perfect read the noise within a space. Additionally, the conditions of a space may change between the time that the individuals perform the noise measurements, and when the individuals enter the room. The margin accounts for these change.
Low-frequency noise is more difficult to fix than high-frequency noise. For instance, if the fan or ducts within a space have already been installed, it may be costly to add mass or silencer to those fans or ducts. By contrast, it is easier to fix problems in the high-frequency bands.
Thus, while the noise rating calculator will not tell an individual how to fix the problems with the HVAC system, it will allow individuals to understand where to look for the problem. If the 31.5 Hz or 63 Hz bands of noise are the issue, for instance, then the solution to the HVAC system is likely to be found within the mechanical plant itself. Even if a spectrum meets the requirements of the target noise rating, the sound within the space may not be pleasant to the ears of individuals who enter the space.
A spectrum that matches the noise rating targets may also contain a tone that is unpleasantly to the ears of listeners. The tone may be strong within one band yet low in the others. The ear is aware of the differences between the bands.
It is possible, however, for a spectrum that is slightly higher than the target noise rating, yet evenly distributed within each band, to be less intrusive than the lower noise level with the high-band noise spike. The calculator calculates the overall energy units that is not the same as the A-weighted measurement of noise. The overall energy unit, however, does act as a form of sanity check.
If the energy levels calculated by the calculator are much more higher than the decibel measurement from a handheld meter, there is an issue with either the measurements or with the noise sources that are not accounted for in the HVAC system. Regular use of the noise rating calculator will change how an individual listen to noise. With experience using the calculator, an individual will know which bands of noise is important in different types of spaces.
Additionally, individuals will understand that addressing the worst band of noise is the most efficient way to address a high noise level. Focusing on the worst band of noise will save both time and moneys for an individual or company. The noise rating calculator has the potential to transform a subjective discussion regarding noise into an objective language that all individuals can understand and agree upon.
An architect, an HVAC designer, and an individual who will use the space can all agree to an target noise level prior to construction. Additionally, the calculator can help to ensure that the building meet that target when it is constructed.