NC Curve Calculator
Match octave-band sound pressure readings to Noise Criteria curves, identify the controlling frequency, and compare the result with common music-room targets.
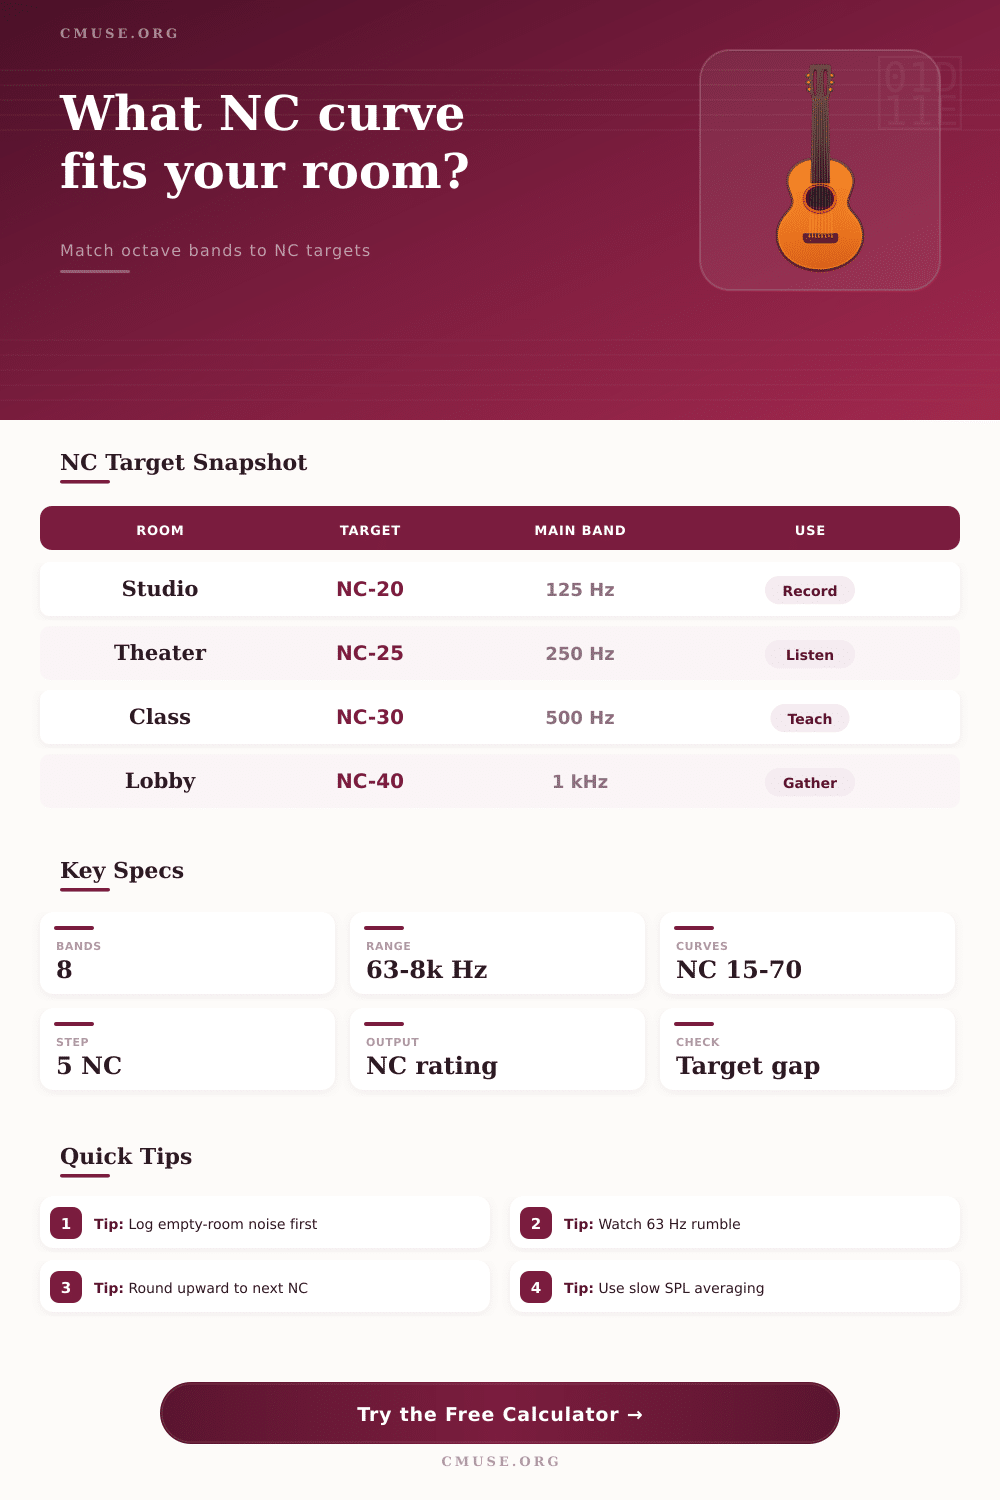
Use unoccupied room measurements with normal HVAC or venue systems running. The calculator compares each band against NC-15 through NC-70 and rates the room by the highest required curve.
Noise Criteria Result
| Band | Measured SPL | Target Limit | Band Margin | Required Curve | Status |
|---|
| Curve | 63 Hz | 125 Hz | 250 Hz | 500 Hz | 1 kHz | 2 kHz | 4 kHz | 8 kHz |
|---|---|---|---|---|---|---|---|---|
| NC-15 | 47 | 36 | 29 | 22 | 17 | 14 | 12 | 11 |
| NC-25 | 54 | 44 | 37 | 31 | 27 | 24 | 22 | 21 |
| NC-35 | 60 | 52 | 45 | 40 | 36 | 34 | 33 | 32 |
| NC-45 | 67 | 60 | 54 | 49 | 46 | 44 | 43 | 42 |
| NC-55 | 74 | 67 | 62 | 58 | 56 | 54 | 53 | 52 |
| NC-70 | 83 | 79 | 75 | 72 | 71 | 70 | 69 | 68 |
| Space | Typical Target | Listening Priority | Result Meaning |
|---|---|---|---|
| Concert hall / recital room | NC-15 to NC-20 | Quiet passages and reverb tails | Small low-frequency excess can be audible |
| Recording studio live room | NC-20 to NC-25 | Microphone noise floor | Target margin matters more than total dB |
| Control room / broadcast booth | NC-20 to NC-30 | Mix decisions and speech clarity | Mid-band control usually dominates |
| Music classroom | NC-30 to NC-35 | Instruction and ensemble detail | Check speech bands from 500 Hz to 2 kHz |
| Lobby / green room | NC-35 to NC-45 | Comfort and conversation | Higher ratings can still be acceptable |
| Step | Formula | Why It Matters | Output |
|---|---|---|---|
| Band demand | Interpolate between adjacent NC limits | Shows which band is pushing the rating | Required curve per band |
| Room rating | Maximum of all band demands | NC is controlled by the loudest relative band | Raw NC value |
| Spec rounding | Round upward to the next 5 NC | Matches normal NC curve naming | Final NC rating |
| Target margin | Target curve minus measured SPL | Negative values show bands over target | Minimum headroom |
| Preset | Target | 63 Hz | 125 Hz | 250 Hz | 500 Hz | 1 kHz | Result Pattern |
|---|---|---|---|---|---|---|---|
| Concert Hall | NC-15 | 45 | 34 | 27 | 21 | 16 | Very low broadband floor |
| Recording Studio | NC-20 | 50 | 39 | 32 | 26 | 21 | Slight low-end air noise |
| Broadcast Control | NC-25 | 54 | 44 | 37 | 31 | 27 | Balanced control-room curve |
| Rehearsal Room | NC-35 | 61 | 51 | 44 | 39 | 35 | 63 Hz controls rating |
| Stage Support | NC-55 | 75 | 68 | 62 | 58 | 55 | Mechanical noise dominates |
Background noises within a performance space or even within a studio setting typicaly contains a variety of different frequencies. Some frequencies may be masked by the room itself, but other frequency become very obvious when the music within the space stops playing. The NC curve method was created to measure each of these different frequency band within the space, as the NC curve method can help to scientifically predict how a space will feel to the listeners within that space.
Instead of reporting a single decibel value for a space, the NC curve method compare each of the octave bands within the space to a family of reference curve. The NC curve method reports a single value that is the rating for the noisiest band of sound within the space. This value can help an architect or a client to discuss with others whether or not the space within a building meet the target that is established for that area.
How NC Curves Measure and Fix Noise in Rooms
The calculator included with the tool will automate the calculations once the user has supplied the octave levels within the space and has selected the use of the space. Each of these bands have different importance within the space, and each of these bands has a different weight. For instance, HVAC systems or traffic outside of the structure commonly create low frequency rumble.
Additionally, low frequency rumble will travel through the structure and linger after the other bands of sound is eliminated from the space. While the space may pass measurements of the overall decibel levels within that area, it may fail an NC check. The band that is controlling the sound within a space is the band that indicates where money should of been spent to treat the space or to make changes to the equipment within the area.
Control within the mid-band of sound is also important. Speech and the attack of instruments tend to happen within the 500 Hz and 2 kHz range. If the levels within these bands are near the target for the space, listeners will experience a much clearer sound from the area.
Additionally, the calculator will display the margin of each of the bands. If there is a negative margin within only one octave band, this may indicate a problem within that specific area. If there is a negative margin within a series of bands, however, this may indicate a problem with the background noise within the space.
The reference tables included within the tool are not meant to be memorized by the users, but exist as a helpful tool to allow the users to understand how different NC ratings will translate into various use of that space. For instance, an NC-20 value may indicate that the space is appropriate for quiet conversations to take place in the back of a recital hall. An NC-35 value for a recital hall, however, may be too loud for the soft detail of the musicians that are to be recorded within that space.
Additionally, while the difference between an NC-20 and an NC-35 value is small at 15 points, this 15-point difference can have a significant impact upon a projects schedule as to whether or not it will need to perform additional commissioning, or whether it can remain on schedule to open the establishment. Some of the most common mistakes with the NC rating system are measuring the room while individuals occupy the area, or while the HVAC systems within the building are utilizing an atypical mode. If the sound is measured during these periods, the rating will indicate a sound level that does not typically occur within the area during normal operation of the establishment.
Another common mistake is rounding the result of the measurement either downward or upward. Because the NC curves are established in 5 point increments, it is important that the result is rounded up to the next highest curve that include all of the octave bands that are measured within the space. Should the result be rounded down, the space may have a background noise level that is too high for the establishment to emit that level of sound during normal operation.
The calculator will produce an estimate for the A-weighted level of the space, but that A-weighted measurement should not be used as a means of replacing the NC measurement. The A-weighted level of sound will compress the contribution of low frequency sounds, whereas the NC curves retain the contribution of those low frequency sounds. Thus, for areas that require low volumes of music or speech to be intelligible, the A-weighted measurements will hide information from the users about the true nature and level of noise within that space.
In addition to the eight-band noise measurement, there are various other variables to consider within a room in addition to the calculations that can be made with the calculator. For instance, the reverberation time within the space may increase the length of time that the noise from an area continues to echo within the space. Additionally, the number of individuals that occupy the space or the type of curtains within the space may impact the level of noise within the space.
Additionally, the temperature within the space and the humidity within the area may impact the transmission of sound through the ducting that may be established in the area. None of these factors invalidate the measurements that are made with the calculator, but they do indicate that the NC measurement is only a snapshot of the sound within that area at a specific time. If the actual space does not meet the measurements that are made with the tool, it is important to ensure that the condition of that space were similar to those established in making the measurement.
The band that is determined to be the controlling band within an area will help to indicate the type of solution that is required to fix that problem within the area. For instance, if the controlling band is at 125 Hz, a solution may involve relocating the HVAC systems or adding a silencer to that system. However, if the controlling band is within the 500 Hz or 1 kHz range, solutions may involve adding diffusers to the area to even out the reflection of sound within that space, or ensuring that the doors within that area are not allowing sound to leak out of the establishment.
Thus, knowing which band leads an NC rating allows for individuals to recognize potential troubleshooting solution for that specific band. Overall, the NC rating for an area is not only a communication tool for the architects and the clients that utilize the tool, but is also a technical tool that allows for the individuals to understand which bands of sound within an area will remain controlled. If the measurements of sound within that space are within the target that is established for that space, the space is ready for use.
If the measurements are outside of the target for that space, the band-by-band view of the space will allow the users to recognize in which band the issues with the sound levels exist.