Loudness Range Calculator
Estimate loudness range, gated short-term spread, normalization gain, projected true peak, and dynamic suitability for music, speech, film, broadcast, and streaming masters.
Load a real production scenario, then adjust the measured loudness values from your meter. LRA is based on the gated short-term loudness distribution: the 95th percentile minus the 10th percentile.
Calculation Breakdown
Loudness range
LRA = P95 - P10
Uses gated short-term loudness percentiles, not raw peak level.
Effective gate
Gate = max(A, I - R)
A is absolute gate, I is integrated loudness, R is relative offset.
Normalization gain
Gain = Target - I
Positive gain raises the program; negative gain turns it down.
Peak after gain
TP' = TP + Gain
Projected true peak should remain below the selected ceiling.
LUFS
Integrated loudness unit
LU
Relative loudness difference
3 s
Short-term window
400 ms
Momentary window
P10
Quiet gated percentile
P95
Loud gated percentile
dBTP
True peak scale
-70
Common absolute gate
| Program type | Tight LRA | Open LRA | Common use | Watch point |
|---|---|---|---|---|
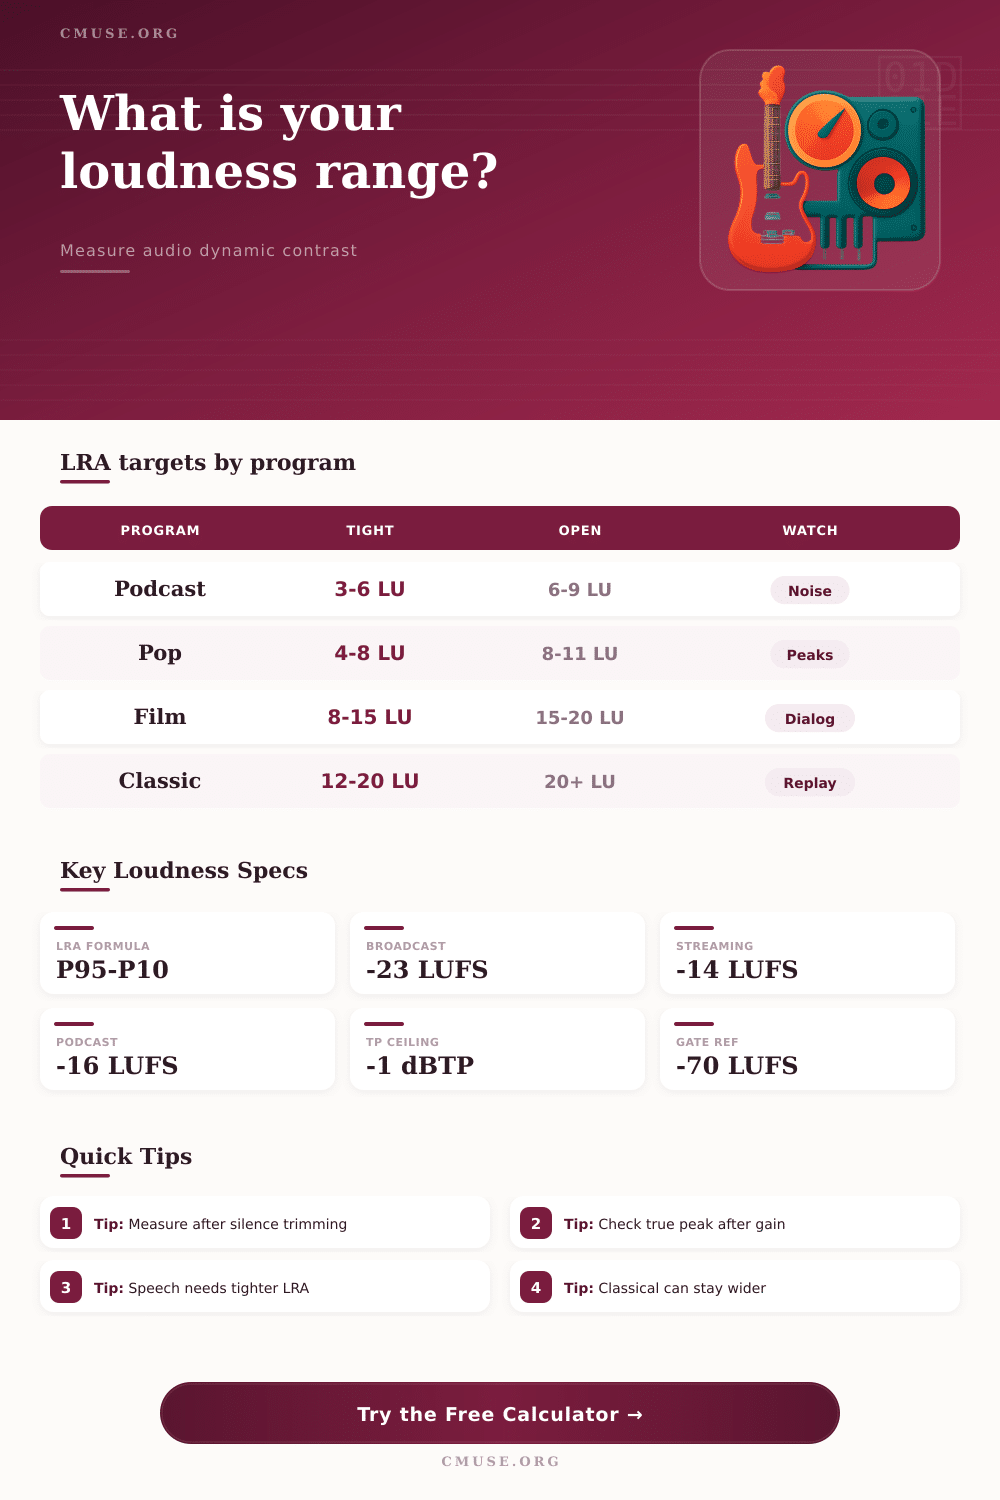
| Podcast / interview | 3 to 6 LU | 6 to 9 LU | Spoken-word consistency | Room tone and edits can inflate P10 |
| Pop / streaming master | 4 to 8 LU | 8 to 11 LU | Playlist-friendly dynamics | Projected true peak after platform gain |
| Classical / acoustic | 12 to 20 LU | 20+ LU | Wide musical contrast | Quiet sections may need listener context |
| Film dialogue stem | 8 to 15 LU | 15 to 20 LU | Scene-to-scene expression | Dialogue intelligibility after downmix |
| Electronic / club | 2 to 5 LU | 5 to 8 LU | Dense rhythm material | Limiter release can flatten perceived punch |
| Broadcast magazine | 5 to 10 LU | 10 to 14 LU | Mixed speech and music | Segment transitions need consistent loudness |
| Delivery target | Typical integrated loudness | True peak guide | Useful LRA area | Best fit |
|---|---|---|---|---|
| Broadcast program | -23 LUFS | -1 to -2 dBTP | 5 to 15 LU | TV, radio, compliance mixes |
| Streaming music | -14 LUFS | -1 dBTP | 4 to 11 LU | Songs, EPs, album tracks |
| Podcast stereo | -16 LUFS | -1 dBTP | 3 to 9 LU | Dialogue-led episodic audio |
| Film dialogue | -27 LUFS | -2 dBTP | 8 to 20 LU | Post-production dialogue anchors |
| Web video | -18 to -12 LUFS | -1 dBTP | 4 to 10 LU | Creator video, lessons, explainers |
| Meter value | Meaning | Time basis | Used in calculator | Practical note |
|---|---|---|---|---|
| Integrated LUFS | Program average loudness | Full selection | Normalization and relative gate | Trim long silence before judging |
| Short-term LUFS | Rolling loudness contour | 3 seconds | P10, P95, and LRA | Main input for dynamic spread |
| Momentary LUFS | Fast loudness movement | 400 ms | Momentary lift over P95 | Shows brief emphasis and punch |
| True peak dBTP | Inter-sample peak estimate | Sample oversampled | Projected peak after gain | Leave margin for lossy encoding |
| LRA in LU | Dynamic range descriptor | Gated short-term spread | Primary result | Not the same as crest factor |
| Scenario | Integrated | P10 | P95 | Expected result |
|---|---|---|---|---|
| Podcast Interview | -16.0 LUFS | -20.0 LUFS | -14.7 LUFS | 5.3 LU, controlled speech |
| Pop Streaming Master | -14.5 LUFS | -19.8 LUFS | -10.9 LUFS | 8.9 LU, open pop master |
| Classical Movement | -23.5 LUFS | -36.0 LUFS | -12.2 LUFS | 23.8 LU, wide concert range |
| Film Dialogue Stem | -27.0 LUFS | -35.4 LUFS | -19.2 LUFS | 16.2 LU, cinematic contrast |
| EDM Club Mix | -8.8 LUFS | -11.6 LUFS | -7.4 LUFS | 4.2 LU, dense and loud |
There’s a reason there are loudness standards: When changing from channel to channel, you don’t want to be jarred by a change of volume level. On top of that, content-creators needs to be able to maintain some sort of creative dynamic range while meeting technical requirements of matching streaming specs. That makes for a bit of a puzzle.
Plug your metering information into the calculator above, and let it do the math for you. Then, instead of guessing whether or not an amount of gain is going to knock down your headroom before you export the file, guess what? You won’t have to guess anymore, and you won’t waste any more time.
How to Use the Loudness Calculator
Loudness Range (LRA) is the main metric. Loudness Range is calculated as difference between the loudest part of a program and the quietest part excluding extreme outliers. It’s based off gated short-term loudness distribution: Ninety-Fifth Percentile minus Tenth Percentile. Long pauses where signal drops below the noise floor are ignored. Short bursts of sound don’t throws off this measure. It’s about the dynamic contrast that you can hear, not just the traditional peaks and valleys in levels. It’s measured across only stuff above the noise floor.
The tool then inputs percentile and integrated loudness numbers and spits out the number that indicates how far you have to turn your file up (or down) in order for it to conform to the platform targets. Generally speaking, Apple Music and Spotify aims for minus fourteen LUFS. If your song is minus sixteen, it gets boosted by two decibels. And this boost impacts the true peak, where many engineers trip up.
They focus on integrated loudness but neglect looking at the ceiling. Gain adjustment affects the true peak. Adjusting the gain on a file that has close to digital maximum inter-sample peaks could result in distorted decoded audio. The calculator will alert you to this possibility. Even at lower volumes, clipped audio is rough sounding and unprofessional. You’d like the track to reach the target loudness while maintaining its integrity.
Not all projects demand the same dynamic range. For example, a podcast interview benefits from consistency: A narrow range around three to six LU is perfect. You don’t want your listeners hunting for their volume control during the interview. A pop track may shoot for four to eight LU to deliver punchy choruses but not sound flat. Conversely, classical music loves contrast with a broad range anywhere from twelve to twenty LU or beyond. This keeps the song’s arc moving from the quiet string section to the full orchestra climax.
The table of references give you some benchmarks for various types of projects. Real world metering behavior informs the tool’s input. Absolute gate is typically set to -70 LUFS, where background hiss gets muted. Otherwise it will inflate the quiet side calculation. Relative gate adapts to amount of integrated loudness so you don’t get penalized with a lower average level for quieter programs. Finally, there’s a limiter recovery setting that estimates how much dynamic range survives after limiting. Transparent limiting conserves dynamics and keeps the range wider; aggressive limiting smashes dynamics and reduces LRA.
To use this tool is not about precise numbers but it’s about trade-offs. Pull back on the limiter to reduce distortion and you lower the true peak, but you’ve widened your LRA. Now do you think that will work within the expectation of the genre? It becomes a conversation with dynamics, clarity and loudness.
Context is everything in mastering. I don’t mean “how does it sound next to other things?” Instead, I am talking about how it compares to industry standards and what the artist wants. The engineer can do the math with the calculator. But will it sound good when you put it into your head-phones? That’s the last pass; the place where engineering gives way to art.
The listener should of be thinking about the story, not the volume control.