Inter-Aural Cross Correlation Calculator
Estimate binaural IACC from level balance, path delay, phase offset, direct sound, lateral energy, and late-field decorrelation.
🎧Listening Presets
🎛Binaural Correlation Inputs
Estimated Binaural Correlation
📊Current Spec Grid
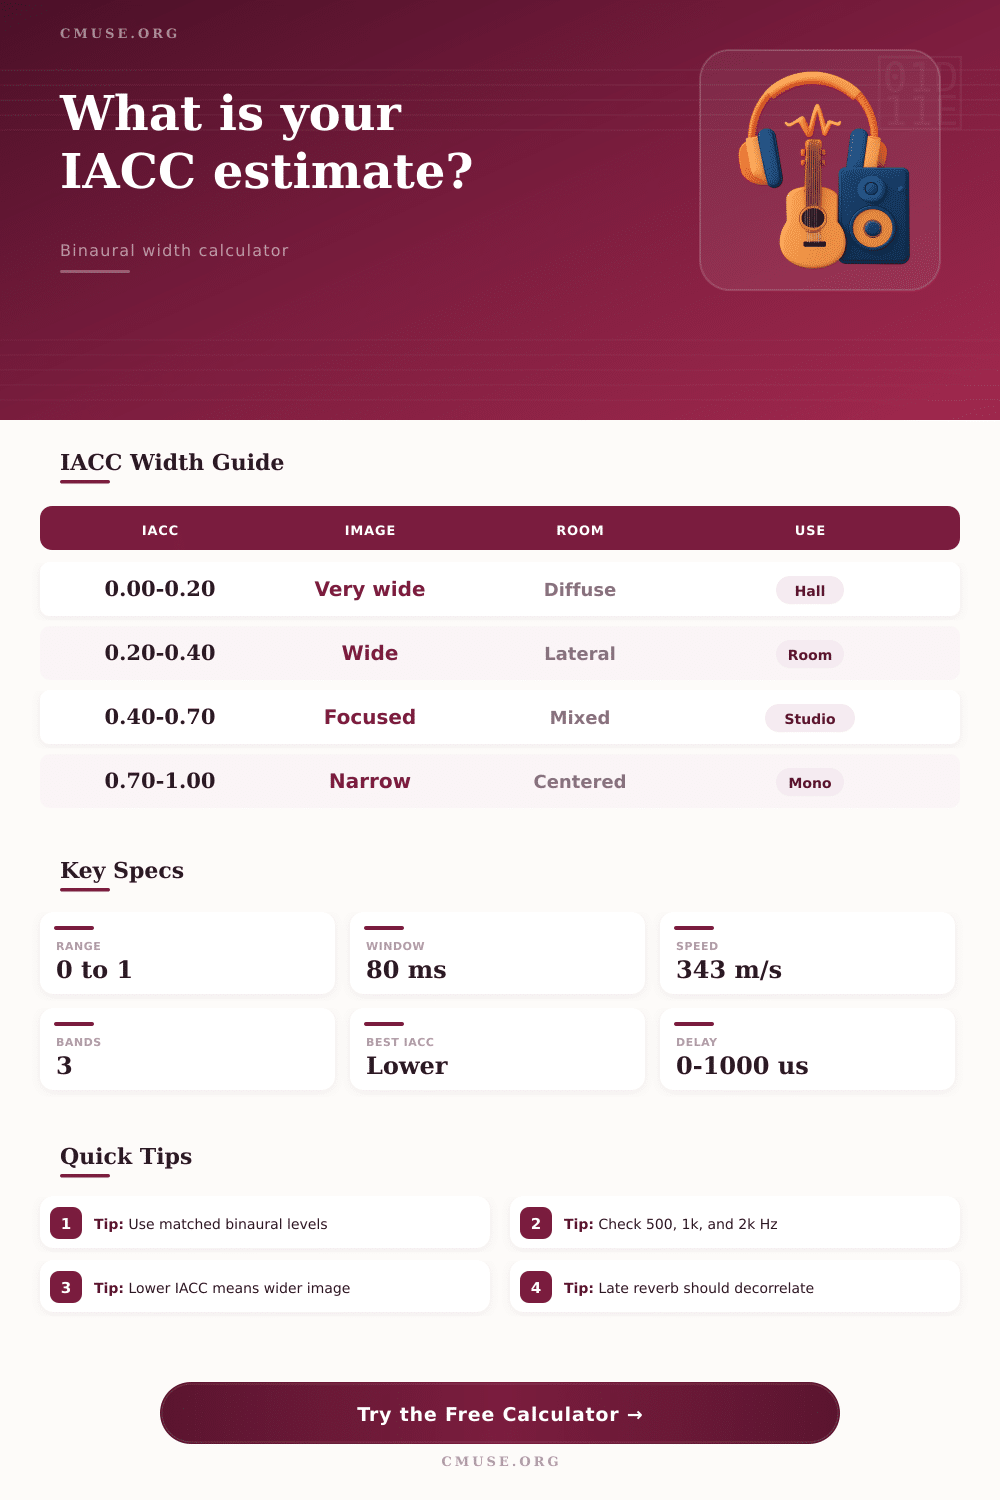
📐IACC Interpretation Table
| IACC Range | Spatial Impression | Likely Cause | Typical Use |
|---|---|---|---|
| 0.00 to 0.20 | Very wide, enveloping, diffuse | Strong lateral energy or decorrelated reverb | Concert hall spaciousness, ambient beds |
| 0.20 to 0.40 | Wide with clear stereo spread | Balanced direct sound and early reflections | Room mics, orchestral pickup, stereo ambience |
| 0.40 to 0.70 | Focused but still stereo | Strong center image with some lateral cues | Nearfield monitoring, vocal-forward mixes |
| 0.70 to 1.00 | Narrow, centered, mono-like | Matched channels, low delay, high crossfeed | Mono checks, speech, spot microphones |
🔀Delay And Phase Reference
| Delay | Path Difference | Phase At 500 Hz | Phase At 2 kHz |
|---|---|---|---|
| 100 µs | 3.43 cm / 1.35 in | 18° | 72° |
| 250 µs | 8.58 cm / 3.38 in | 45° | 180° |
| 500 µs | 17.15 cm / 6.75 in | 90° | 360° |
| 800 µs | 27.44 cm / 10.80 in | 144° | 576° |
🎵Use-Case Target Table
| Use Case | Useful IACC Zone | Main Control | Practical Reading |
|---|---|---|---|
| Symphonic hall seat | 0.10 to 0.35 | Lateral early reflections | Lower readings usually feel more enveloping. |
| Nearfield mix position | 0.45 to 0.75 | Speaker symmetry and center image | Moderate readings keep focus without full mono. |
| Ambience microphone pair | 0.15 to 0.45 | Spacing, angle, and room returns | Lower values help beds sit around the source. |
| Mono compatibility check | 0.80 to 1.00 | Channel match and polarity | High positive correlation is expected. |
📋Preset Summary Table
| Preset | Frequency | Path / Delay | Expected Character |
|---|---|---|---|
| Concert Hall Center | 1000 Hz | 2.75 in / 0 µs | Balanced spaciousness with stable front image |
| Mix Sweet Spot | 1000 Hz | 1.20 in / 0 µs | Focused center with controlled stereo width |
| Speaker Delay Test | 2000 Hz | 0.50 in / 220 µs | Phase-sensitive image shift and comb risk |
| Diffuse Reverb Return | 500 Hz | 7.00 in / 110 µs | Low correlation, wide late-field wash |
💡Calculation Tips
Inter-aural cross correlation, or IACC, is a measurement of how similar the sound waves is at each ear. High IACC values means that each ear hears the same sound, resulting in a narrow sound image. Low IACC values indicate that each ear hears a different sound, resulting in a wide sound image.
Listen to a concert hall or recording where the sounds appear to wrap around you indicates a low IACC value. The geometry of the sound field affects the measurement of IACC. Sound reaches one ear before it reach the other.
How IACC Makes Sound Wide or Narrow
Furthermore, because the head sit between the ears, the head delays the sound reaching each ear; the two ears hear the sound at different levels. These differences in time delay and sound level lowers the IACC value. Additionally, the reflections from the side walls and ceilings of a concert hall provide each ear with different information; this also lower the IACC value.
Furthermore, the late reverberations that reach each ear from a concert hall can arrive from many different angle at once. These low IACC values create the sensation of envelopment within a concert hall for the listener. Furthermore, the engineers that create sound recordings must take IACC into consideration when placing the microphones.
Using a spaced pair of microphones will create a more low IACC value than a coincident microphone pair because the sound capsules are located several inches from one another. Furthermore, placing the microphones further from one another will create a time and level difference between each microphone that impacts the listener’s perception of the width of the sound image. However, spacing the microphone may create comb filtering; a balance must be found between sound width and sound clarity.
Furthermore, by using a calculator that asks for the level balance, the path difference between microphones, and the ratio of direct sound energy to lateral sound energy; the calculator will provide a single coefficient that describes the IACC value between the two microphones. Phase is another factor in the IACC value; the phase of the sound change with frequency. For example, a small time delay may have a noticeable effect on the sound at 500 Hz but have a much larger phase shift at 2 kHz that lowers the IACC value.
Furthermore, a negative coefficient lowers the perceived stability of the sound; the sound may appear to feel hollowly. Furthermore, because the phase shift change with frequency, it is important to check the IACC coefficient at various frequencies. This same principle can be applied to electronic delays; a headphone mix that employs electronic delays will have a phase shift at high frequency.
The acoustic properties of the room also impact the IACC value. If the reflections of the sound from the side walls arrive within the first 80 milliseconds, those reflections will lower the IACC value of the sound without destroying the sound clarity. Many concert hall employ angled surfaces to reflect the sound off the walls.
Furthermore, late reverberations of sound may be decorrelated from the direct sound that reaches the listener; such late reverberations may widen the sound image. However, too much late reverberation will mask the direct sound. Furthermore, if there is too much late reverberation, the sound will lose its focus; there will be too much reverberation in the sound.
Too little late reverberation will make the room feel small; a high late-field correlation coefficient may be utilized with sound systems so that the late reverberations are masked or remove. Furthermore, engineers or architects can adjust the late-field correlation coefficient to allow them to hear how the sound will behave in the space. Headphones impact the IACC measurement of sound.
With headphones, the sound is not reflected off the walls of the listener’s head. Therefore, two ways to achieve a low IACC value when listening through headphones is to use the recording of the music that features a low IACC value or to incorporate crossfeed into the headphone mix. Listeners often find that highly correlated headphone sound becomes fatigue, so the addition of a small amount crossfeed will create the perception of a sense of space around the headphone listener.
Furthermore, IACC can be used to assess the compatibility of mono sound. If IACC remains high when the sound channels are summed to mono, the center of the sound will remain; if the IACC coefficient collapses, the sound is relying upon cancellation that will disappear in mono sound. Furthermore, the IACC coefficient only provides a means of comparison between spaces, sound systems, and sound recordings.
For example, an IACC of 0.35 may create a wide sound image in a concert hall but may too diffuse for a listener who is listening to a close-miked kit drum sound. Thus, the coefficient is only a means of comparison; the engineer or audio designer must still use their ears to listen to the music. Furthermore, the IACC coefficient allows the designer to focus on the sound image rather than have to rely upon their ears to determine if the coefficient is high or low.
A high IACC coefficient will create a narrow sound image; a low IACC coefficient will create a wide and enveloping sound image.