Group Delay Distortion Calculator
Estimate excess group delay, phase-slope delay, cycle displacement, and audible risk for loudspeakers, crossovers, rooms, processors, and playback filters.
🎧 Measurement Presets
📈 Distortion Inputs
🎼 Audio / Instrument Spec Comparison
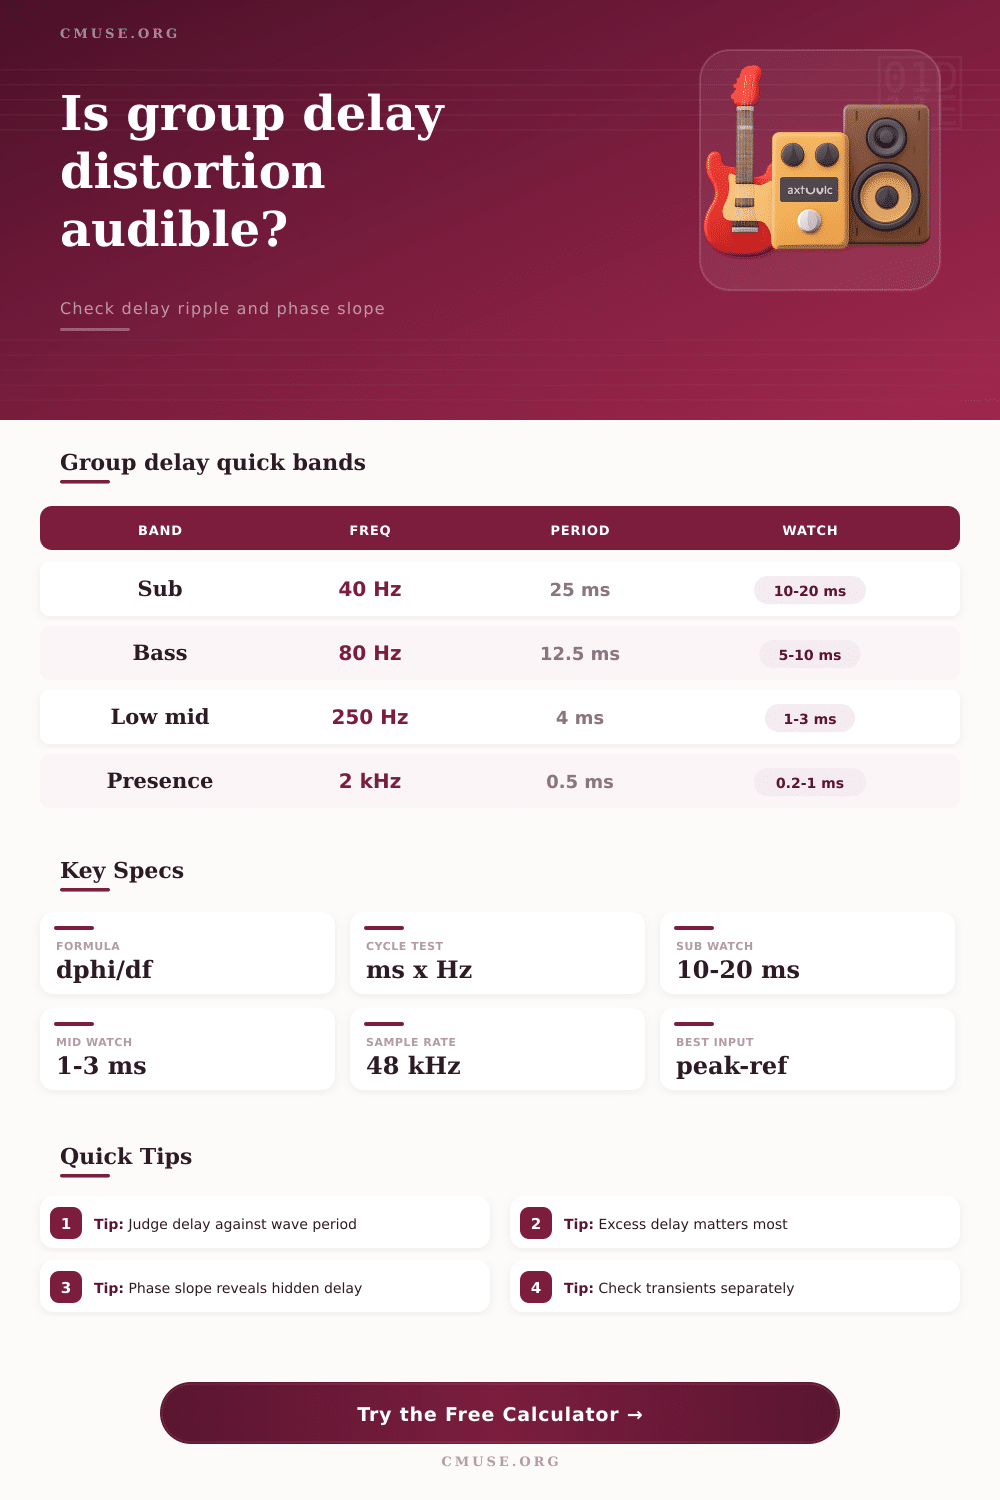
📊 Frequency Period And Delay Watch Table
| Region | Center Frequency | One Cycle Period | Practical Watch Range |
|---|---|---|---|
| Deep sub | 30 Hz | 33.3 ms | 15 to 30 ms excess delay |
| Sub crossover | 80 Hz | 12.5 ms | 5 to 12 ms excess delay |
| Upper bass | 160 Hz | 6.25 ms | 2 to 6 ms excess delay |
| Low midrange | 400 Hz | 2.50 ms | 0.8 to 2.5 ms excess delay |
| Presence | 2 kHz | 0.50 ms | 0.2 to 1.0 ms excess delay |
🔊 System Type Comparison
| System | Typical Delay Feature | Most Sensitive Band | Calculator Use |
|---|---|---|---|
| Bass reflex speaker | Delay hump near port tuning | 25 to 90 Hz | Compare excess delay to low-frequency cycle period |
| Steep IIR crossover | Phase rotation around crossover | 500 Hz to 4 kHz | Watch phase-slope delay and transient material |
| Linear-phase FIR EQ | Pre-ringing and symmetric delay | Broadband, often bass boosted | Check delay magnitude and sample offset together |
| Room correction | Narrow modal ringing or correction ripple | Room modes below 300 Hz | Use repeatable measurements before judging risk |
| PA steering / fills | Intentional arrival-time offsets | Crossover and vocal range | Keep delay distortion separate from alignment delay |
⏱ Sample Offset Reference
| Delay | 44.1 kHz | 48 kHz | 96 kHz |
|---|---|---|---|
| 0.25 ms | 11 samples | 12 samples | 24 samples |
| 1.00 ms | 44 samples | 48 samples | 96 samples |
| 5.00 ms | 221 samples | 240 samples | 480 samples |
| 10.0 ms | 441 samples | 480 samples | 960 samples |
| 25.0 ms | 1103 samples | 1200 samples | 2400 samples |
🧪 Common Measurement Scenarios
| Scenario | Band To Inspect | Primary Red Flag | Secondary Check |
|---|---|---|---|
| Ported subwoofer tuning | 20 to 90 Hz | Large excess delay near tuning | Cycle fraction at the tuning peak |
| Two-way crossover | 1 to 4 kHz | Delay bump around handoff | Phase slope through the crossover octave |
| Room correction filter | 30 to 300 Hz | Narrow modal delay spikes | Repeatability after smoothing changes |
| IEM crossover | 500 Hz to 8 kHz | Small but high-frequency delay ripple | Phase equivalent in degrees |
| Mastering linear-phase EQ | 20 Hz to 20 kHz | Long latency at low-frequency shelves | Transient program sensitivity |
What about group delay? That’s how long it takes for different frequencies to move through a system. Ideally all the frequency reach your ears with equal relative time. But real-world filters and speakers has differing amounts of delay, where maybe the fundamental tone of bass guitar doesn’t show up until after kick drum. That mismatches timing and distorts what we hear, blurring the quick start of instrument.
This handy calculator turns confusing phase traces into useful numbers, letting you know whether something in your system are harming your sound (or simply following laws of physics). So what the tool does is measure blur based off an excess of delay (not absolute arrival time). Your brain automatically adjusts to a fixed amount of delay over all frequencies. It’s the ripple in this delay curve that’s important.
How Group Delay Affects Sound Quality
Once you’re inside a peak group delay and a reference level, the system will computes exactly how far ahead in time certain frequency are being delayed beyond normal. Then it compares that excess time against the period of wave itself at that same frequency. The bigger the fraction of one full cycle the delay is, the more phase shift warps the waveform, which you’ll hear as lost definition or other coloration.
And then there’s context. What feels like a tiny amount of extra delay (ten ms) may go unnoticed on busy pad synth sound, yet prove devastating on single-note solo piano piece. This is why the calculator also wants to know how sensitive you are to material: Because while sustain-based sounds tends to hide timing errors, transient-rich instruments such as live drums and acoustic guitars will let them shine through.
In other words, are you testing whether system blurs the attack before your ear has time to pick it up? Because at low frequencies, where a 40 Hz sub bass takes twenty-five milliseconds to complete one cycle, a ten millisecond delay represent almost half a cycle shift, quite a significant shift. At higher ones, say 2kHz, that same delay stretches out over twenty whole cycles, which is now acoustically negligible on sustained notes, but could of still be pretty nasty on transient-laden sounds.
There’s also another solution to this issue which doesn’t measure time at all: phase slope. Group delay are the derivative of phase. Therefore, if the phase angle change very rapidly across a small slice of frequency, the delay must be large in that frequency range. The calculator takes the phase angle that you enter as a “swing” and computes what the corresponding delay would be for comparison against your actual impulse measurements. It combines two perspectives on the same type of measurement into a single number. This stops you from going around in circles looking at the chaos of wrapped phase plots without finding anything meaningful about how they relate to timing.
Alignment delay isn’t distortion. Having your multiple speaker aligned so their respective drivers fires at the same time minimises comb filtering; this is good. Distortion comes from having that alignment vary wildly within the audible range, resulting in spikes and troughs in the time domain response. By looking at your specific frequency band, the size of any delay spike, and how sensitive your audio material are, we can show you how much of what you are hearing actualy matters in a practical sense. This doesn’t remove the need for listening tests, but it takes out the guesswork about whether what you’ve measured is audible or merely a mathematical noise.
That’s how you keep your source material consistent over time. You want to keep the same tonal balance over time; the attack remains sharp. If you ground your measurements in terms of wave periods instead of some abstract phase angle, you begin to make decisions based on what ear actualy hears. Fix the timing, and all too often, the tonal issues resolves themselves as well.