Crest Factor Calculator
Measure peak-to-RMS spread, estimate headroom, and test limiter margin for speech, music, drums, and mastering chains.
📈Quick Formula Guide
🎸Real Program Presets
Load a source profile to fill the form with a realistic crest range, window size, detector choice, and safety margin.
⚙Measurement Inputs
All readings must stay on one selected scale.
Breakdown
📊Profile Comparison Grid
- Calibration reference
- Short analysis window
- Easy meter check
- Consonant peaks matter
- Medium buffer helps
- Limiter-friendly range
- Fast attack energy
- True peak preferred
- Transient rich source
- Wide dynamic range
- Longer window helps
- Keep generous room
📋Reference Tables
| Crest Band | Linear Ratio | Typical Feel | Common Source |
|---|---|---|---|
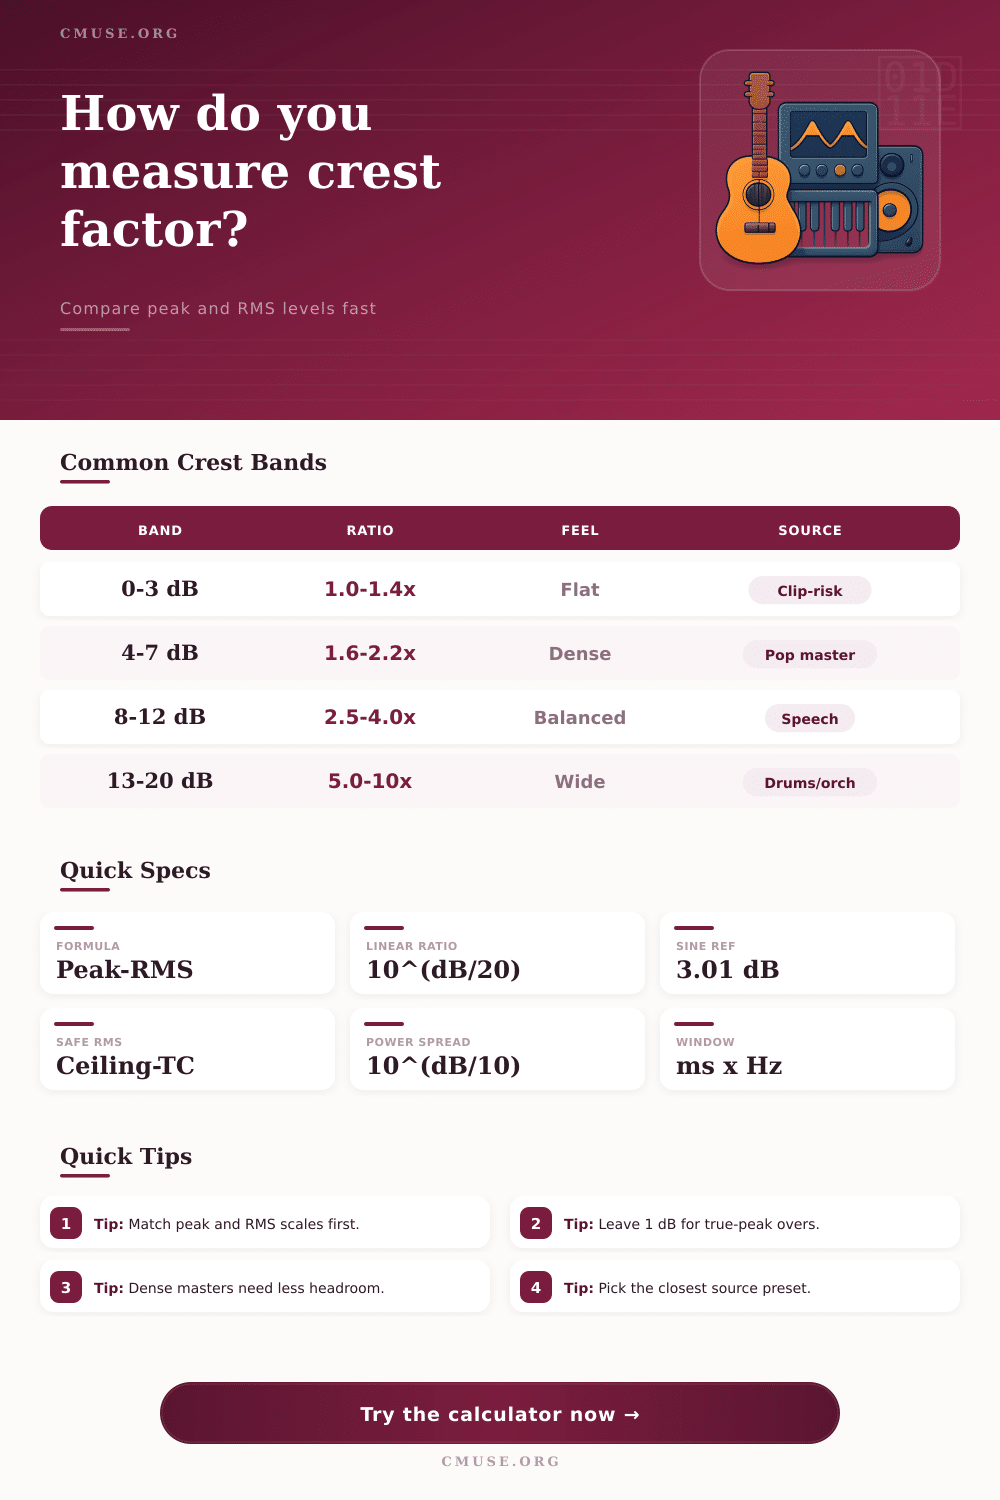
| 0-3 dB | 1.0-1.4x | Flat | Clip-risk |
| 4-7 dB | 1.6-2.2x | Dense | Pop master |
| 8-12 dB | 2.5-4.0x | Balanced | Speech |
| 13-16 dB | 4.5-6.3x | Open | Guitar |
| 17-20 dB | 7.1-10x | Wide | Drums |
| 21 dB+ | 11x+ | Huge | Orchestra |
| Program Material | Typical Crest | Ratio | Meter Note |
|---|---|---|---|
| Sine tone | 3.01 dB | 1.41x | Calibration |
| Broadcast speech | 10-14 dB | 3.16-5.01x | Voice chain |
| Podcast VO | 9-12 dB | 2.82-3.98x | Close mic |
| Pop master | 6-9 dB | 2.00-2.82x | Limited |
| Drum bus | 12-18 dB | 3.98-7.94x | Transient rich |
| Orchestra | 15-24 dB | 5.62-15.85x | Large dynamics |
| Ceiling | Margin | Safe Ceiling | Use Case |
|---|---|---|---|
| -1.0 dB | 1.0 dB | -2.0 dB | Modest limiting |
| -0.3 dB | 0.7 dB | -1.0 dB | Delivery path |
| -6.0 dB | 1.0 dB | -7.0 dB | Mix bus |
| -1.0 dB | 2.0 dB | -3.0 dB | Aggressive chain |
| 0.0 dB | 3.0 dB | -3.0 dB | Raw capture |
| -3.0 dB | 1.5 dB | -4.5 dB | Archive copy |
| Window | Rate | Samples | Best For |
|---|---|---|---|
| 50 ms | 44.1k | 2205 | Drum hits |
| 100 ms | 48k | 4800 | Speech |
| 250 ms | 44.1k | 11025 | Guitar |
| 500 ms | 96k | 48000 | Orchestral |
| 1000 ms | 48k | 48000 | Mastering |
| 2000 ms | 96k | 192000 | Program mix |
💡Practical Tips
Peak and RMS must be read on the same reference before the crest result is meaningful.
A spare dB or two helps absorb true-peak overs and conversion spikes.
Crest factor is a measurement use in audio engineering to measure the relationship between the peak level and the average level of the audio signal. The peak level of the audio signal is the highest point of the signal. The RMS level of the signal is the average energy of that signal.
Crest factor is calculated by subtract the RMS level of that signal from the peak level. If the crest factor is too high, the signal will contain transients that could clip other processors in the signal chain. If the crest factor is too low, the signal may appear dense and lose it’s dynamic range.
What Is Crest Factor and How to Manage It
A good strategy are to manage the crest factor of the signal. Different type of audio signals has different crest factor values. For instance, a sine wave has a crest factor of 3 dB because the peak level and the RMS level of the signal is similar.
Human speech have a crest factor that ranges from 10 dB to 12 dB because of the difference in peak level between consonants and vowels. Drum signals has high crest factors in the range of 15 dB to 20 dB. Pop music masters tend to have lower crest factors, around 6 dB to 7 dB because they is processed to sound dense and loud.
Producers can understand these different ranges to provide insight into how to process these types of signal. If the crest factor is too narrow within a signal, the audio will lose its impact on the listener. However, if the crest factor is too wide, the audio will not be loud enough.
In metering the audio signal, it is important to use the correct measurement scale. If the audio signal is part of a digital audio chain, it is important to use the dBFS measurement scale. For analog audio gear, use a dBu measurement scale.
Using the wrong scale for the audio signal will give incorrect crest factor measurement. Additionally, the audio signal window size will affect the measurement of the signal. For example, a short window size is suitable for audio signal such as drum hits.
For songs and tracks, a longer window size will provide a better average RMS measurement. Additionally, the sample rate of the audio signal affects the measurement. For instance, a higher sample rate will provide more data for the audio meter, allowing the RMS measurement to be more accurately.
Headroom is the amount of space between the peak level of the signal and the ceiling of the audio system. You can use the crest factor to plan headroom and RMS level targets for a song. For example, if the target ceiling is -0.3 dBFS, and true-peak level should remain under -0.3 dBFS, -0.7 dBFS would be a safe ceiling for the signal.
If a target crest factor of 8 dB is targeted, the RMS level can be calculated to provide headroom for the signal limiter. For instance, targeting 8 dB crest factor and a safe ceiling would establish an RMS level that target the limiter correctly so that it does not reach the ceiling of the audio system. Another strategy is to adjust the crest factor based on the type of music.
For instance, acoustic guitar music has a natural crest factor of 12 dB. Orchestral music can have a crest factor of 18 dB or higher. Electronic dance music (EDM) tend to have a lower crest factor of 8 dB because EDM music need to be dense and loud.
However, using a crest factor lower than 4 dB will cause clipping in the signal. Finally, it is important to test the crest factor of different section of the song. For example, the verse of the song may have a different crest factor than the chorus.
Each section should be processed accordingly. For instance, using presets for different instrument, such as a snare drum, can provide insight into the correct crest factor for those instrument. By managing the difference between the peak level and the RMS level, the audio signal will have proper control throughout the signal chain.