Stream Growth Projection Calculator
Forecast streaming totals from starting streams, daily rate, organic growth, playlist lift, campaign timing, decay, and milestone targets.
🎯Scenario Presets
📈Projection Inputs
Projection Results
📊Projection Spec Grid
📋Forecast Tables
Projection Checkpoints
| Checkpoint | Date | Total Streams | Daily Rate | Added Streams |
|---|---|---|---|---|
| Day 7 | - | - | - | - |
Milestone Timing
| Milestone | Status | Projected Date | Days Needed |
|---|---|---|---|
| 10,000 | - | - | - |
Lift Sensitivity
| Scenario | Playlist Lift | Campaign Lift | Projected Total | Peak Daily |
|---|---|---|---|---|
| Current plan | - | - | - | - |
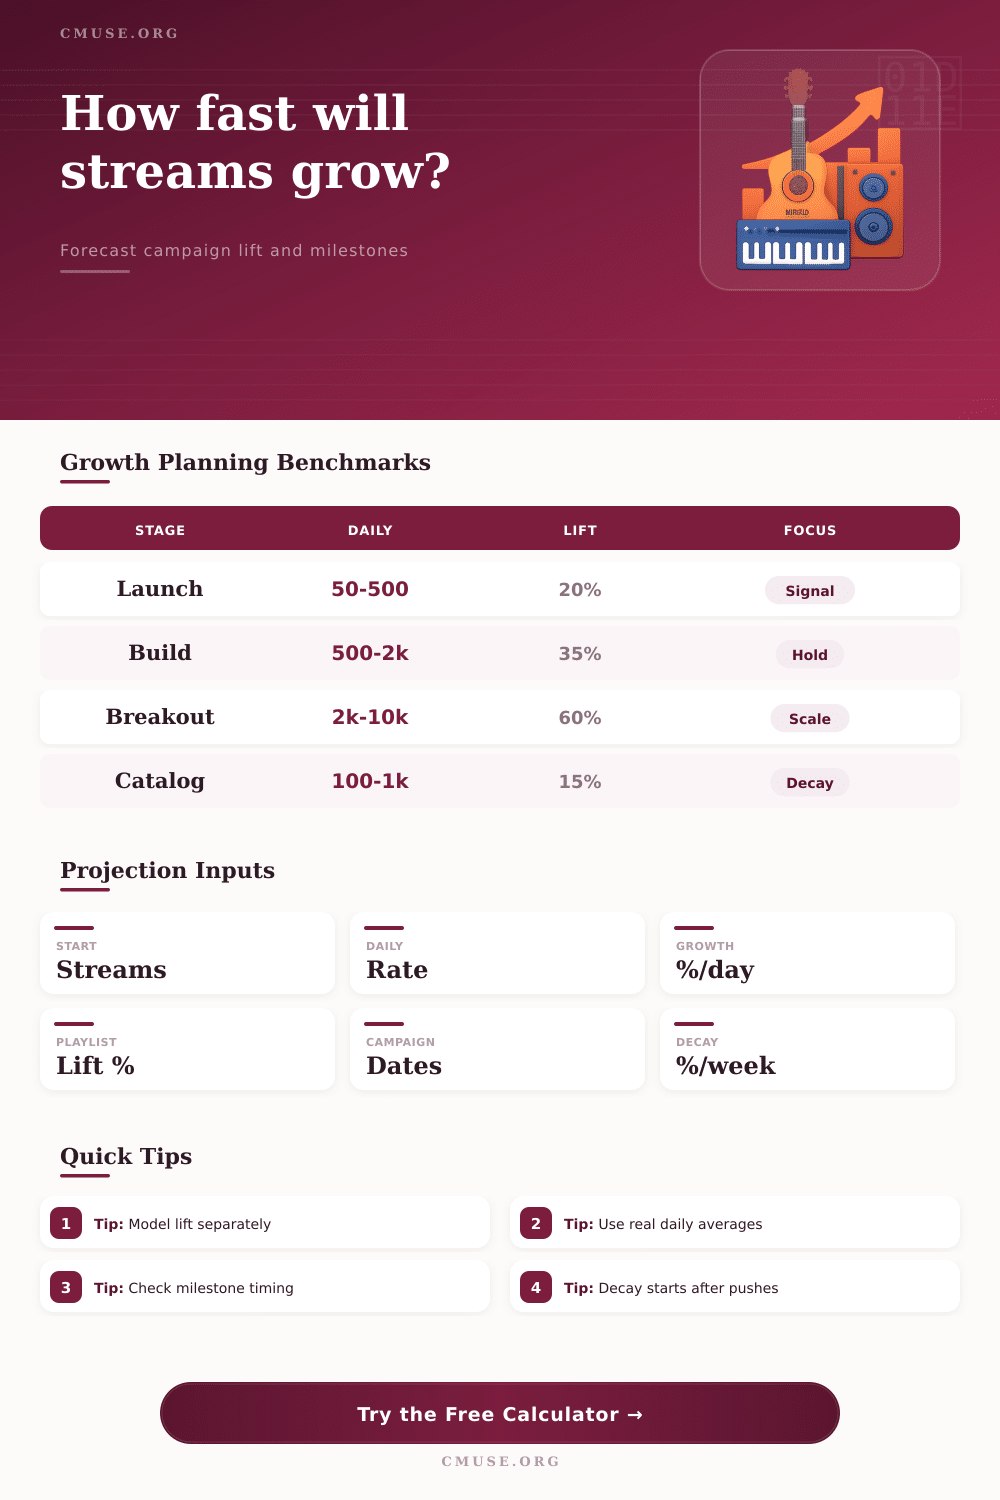
Streaming Growth Benchmarks
| Track Stage | Daily Range | Typical Lift Window | Projection Note |
|---|---|---|---|
| Launch week | 50 to 500 streams | 7 to 21 days | Early rates swing quickly; watch the first decay curve. |
| Growth build | 500 to 2,000 streams | 14 to 45 days | Playlist hold and save behavior usually matter most. |
| Breakout push | 2,000 to 10,000 streams | 21 to 60 days | Campaign lift compounds strongly with organic daily growth. |
| Catalog track | 100 to 1,000 streams | 30 to 90 days | Lower growth with slower decay can still hit steady milestones. |
💡Forecast Tips
Projection values are estimates for planning and comparison. Real streaming behavior can change when algorithmic discovery, listener retention, or release timing shifts.
Without planning, how will a song do? Who knows? Maybe it’ll fly, but it might just go nowhere. It’s typically not random. There is generally some type of reason why a song rise or falls. And that reason isn’t always a hunch. Artist trust their gut, which is fine, unless their gut contradicts the numbers.
Once you enter your starting rate per day along with what percentage increase you assume each day will bring, calculator does the math for you. You can then visually see what future holds for you and stop livig in hope.
How to Plan Your Music Success with Data
First is your baseline. This is average of what you were streaming prior to any new promo. It is not your best day. It is a realistic seven day avg. Inflate that, and everything that follows break. This happens because the model expect steady growth starting from a fake high point.
Second is your org growth %, which is how much things grows organically. This happens via word of mouth from current fan, or how fast algorithms finds you on their own. It is typically quite low, like 3% a day for consistent builds. But that tiny percentage compound rapidly over time. So neglecting it damage long term forecasts.
You should of add external lifts. On top of that organic base is a multiplier: playlist additions and campaign pushes. These differ from one another and the tool separates them out. A playlist add gives you a surge, sustained as long as it’s active, then decays as it’s rotated out or removed. A social media campaign produce a sharper spike that fades more quickly when content run ends. To account for this, you must set start and stop times for each. The calculator include those dates in its model and will help you model the curve accordingly.
Without accounting for decay, your projection may look good on paper but fail in practice, because you’re assuming streams won’t decline after the push dies down. They do, and modeling that decline enable understanding how much residual interest persists.
In the results section, there’s a table of milestones. That show when you’re likely to reach important goals such as ten thousand streams. These are points where playlist pitching and label negotiations comes into play. Knowing the date allows you to plan backwards. Say the projection suggest you’ll hit ten thousand in three months. Your announcement is set for sixty. Uh-oh. Time to up the daily spend, or adjust expectations about how track can support the event.
Planning trumps guesswork on this front. Those numbers make sense when compared to benchmarks. Fifty streams per day growth on launch week is par for the course. Two thousand plays is kicking ass as a breakout track. Use the reference ranges on the interface to compare what’s going on with your situation. If you’re below your benchmark rate for where you are in your stage, it may not have anything to do with promotion, and everything to do with retention. People aren’t clicking through fast enough, and the algorithm stop serving you because they clicked away. You can pump all the playlist lifts into it, but if no one completes the song, nothing will fix it. The leak show up in the math, and then you don’t pour any more water in.
Every time there’s an update to your situation (e.g. Every reporting week) change your inputs. Update the daily rate with current information. Add new lifts from playlists. Adjust the active days/lift percentage. That way the prediction stays up-to-date with real world experience different than old assumptions. Streaming is ever-changing. So should your plan.
The tool’s sensitivity analysis enable you to adjust variables and understand how robust your goal is. How would things go if the playlist lift was twenty percent instead of thirty five? Would it achieve the milestone? If not, then you know where to focus your attention.
Streaming isn’t a lottery ticket. It’s a growth tool with dials and levers. Pull the right lever at the right time. Watch the decay curves. Respect the benchmarks. Your strategy may be working. Or it might just be burning money. The numbers don’t lie. If you’re throwing darts, you’re throwing darts. If you want to aim, look at the board first.