Album Equivalent Units Calculator
Convert album sales, track downloads, and streams into AEU totals with chart, certification, and territory assumptions.
🎯 Real Album Unit Presets
🎵 Album Consumption Inputs
Calculation Breakdown
📊 Current Spec Grid
📐 Ratio Reference Table
| Method | Album Sale | Track Equivalent Album | Stream Equivalent Album | Best Use |
|---|---|---|---|---|
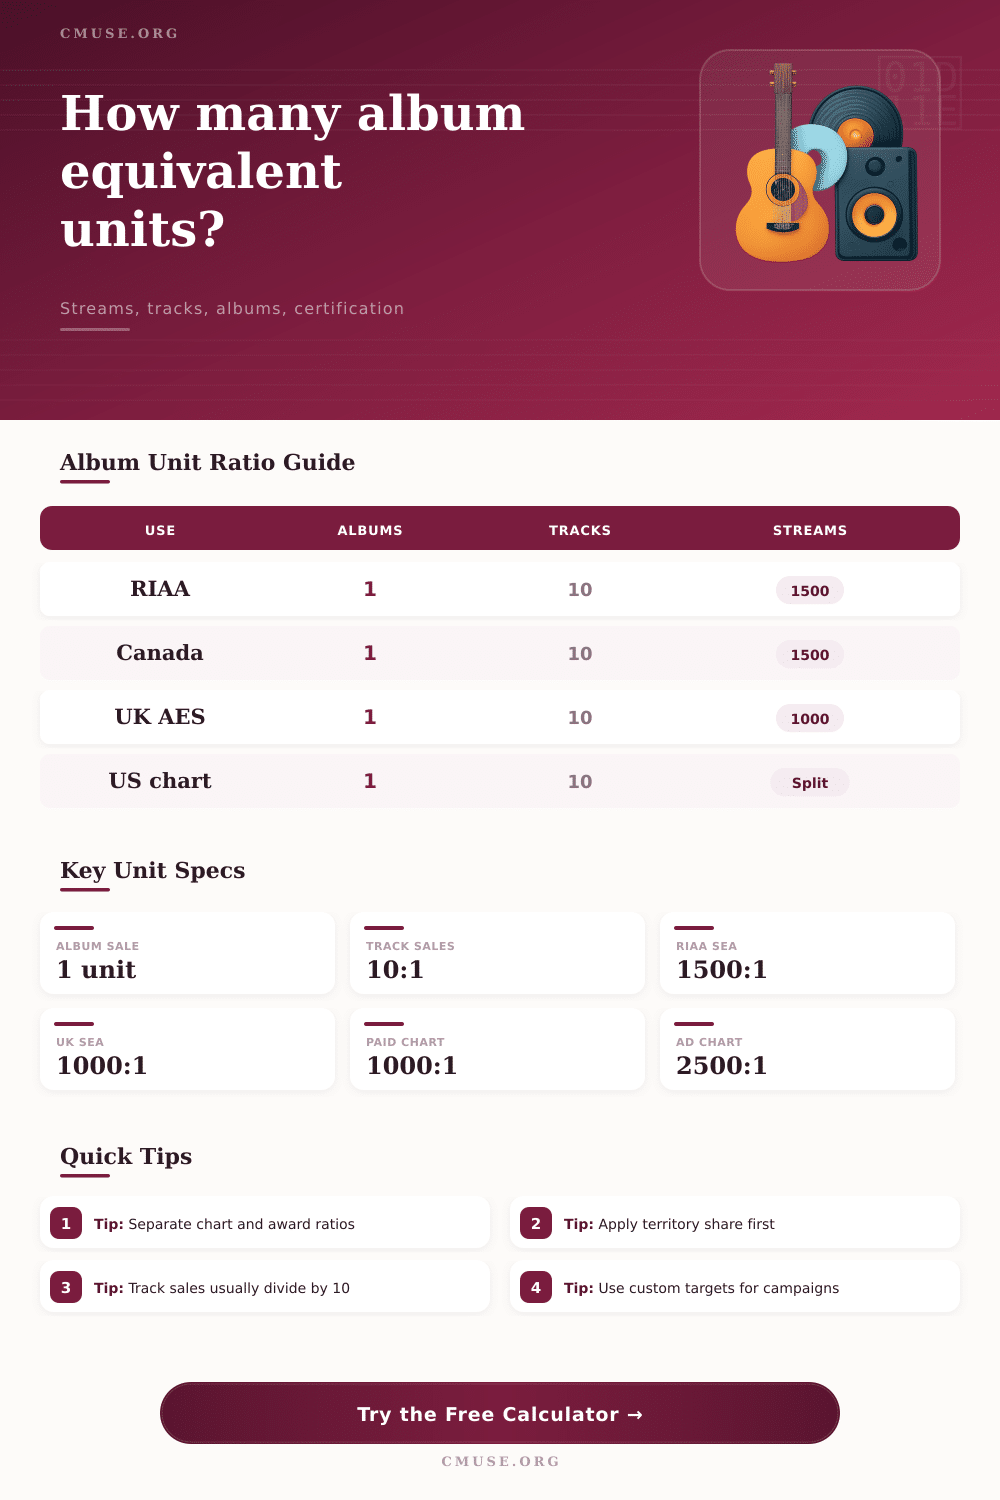
| US RIAA album certification | 1 sale = 1 unit | 10 track sales = 1 unit | 1,500 on-demand audio/video streams = 1 unit | All-time Gold, Platinum, Diamond progress |
| Canada album certification | 1 sale = 1 unit | 10 track sales = 1 unit | 1,500 on-demand audio streams = 1 unit | Canadian Gold and Platinum album milestones |
| UK album AES estimate | 1 sale = 1 unit | 10 track sales = 1 unit | Streams divided by 1,000 for album AES estimate | UK album-level sales plus streaming estimate |
| US chart method, current split | 1 sale = 1 unit | 10 track sales = 1 unit | Premium 1,000:1 and ad/video 2,500:1 | Current U.S. chart-style consumption modeling |
| Custom territory | User-defined | User-defined | User-defined standard or split ratios | Internal goals, blended territories, distributor reports |
🏆 Certification Threshold Table
| Territory | Silver or Gold | Platinum | Diamond or Multi | Calculator Target |
|---|---|---|---|---|
| United States album | Gold: 500,000 units | Platinum: 1,000,000 units | Diamond: 10,000,000 units | Use RIAA album certification |
| Canada album | Gold: 40,000 units | Platinum: 80,000 units | Diamond: 800,000 units | Use Canada album certification |
| United Kingdom album | Silver: 60,000; Gold: 100,000 | Platinum: 300,000 units | Multi-Platinum by 300,000 increments | Use UK album AES estimate |
| Label campaign | Custom milestone | Custom milestone | Custom milestone | Use Custom target |
🎚 Stream Mix Comparison Table
| Stream Mix | Premium Streams | Ad/Video Streams | Approx Units | When To Use |
|---|---|---|---|---|
| Certification single-ratio | Included together | Included together | Total streams / SEA ratio | Award rules using one combined stream divisor |
| Paid-heavy chart week | 10,000,000 | 2,500,000 | 11,000 units at current split | Subscription-driven launch weeks |
| Balanced chart week | 5,000,000 | 5,000,000 | 7,000 units at current split | Mixed premium and free-tier audience |
| Ad-heavy discovery | 2,500,000 | 10,000,000 | 6,500 units at current split | Video, free-tier, playlist discovery activity |
💿 Common Album Scenario Table
| Scenario | Album Sales | Track Sales | Streams | Estimated Units |
|---|---|---|---|---|
| Emerging album audit | 12,000 | 55,000 | 18,000,000 | 29,500 at 1,500:1 |
| RIAA Gold campaign | 210,000 | 700,000 | 255,000,000 | 450,000 at 1,500:1 |
| Canada Gold push | 18,000 | 60,000 | 19,000,000 | 36,667 at 1,500:1 |
| UK Silver album | 24,000 | 110,000 | 32,000,000 | 67,000 at 1,000:1 |
| Catalog Platinum run | 480,000 | 1,800,000 | 650,000,000 | 1,093,333 at 1,500:1 |
When an album comes out there’s a flurry of activity: Digital download numbers. There are physical shipment figures. Video play counts. There is stream counts. You’re staring at metrics within minutes by Tuesday morning. It looks like a mess… But it really isn’t. All these things talks to one another in the end. They’re all talking album equivalent units.
In other words, that’s a way to level the playing field between someone who sells a vinyl record in 2014 and someone whose song goes viral on TikTok in 2026. Once you know how much you’ve consumed, you plug it into the calculator above, and voila! It do the math for you so you don’t have to guess what each of those different revenue streams mean in terms of industry standard milestone.
How Album Sales Are Calculated Today
It’s an idea easy to explain over dinner and difficult enough to make any label executive stumble. One unit = one album sale, which is a base product. From there, it gets complicated by the question of what should counts as single album equivalent and what shouldn’t. Historically speaking, permanent digital track sales are bundled into tens for each single album equivalent. It recognize that five song purchases off a record don’t match same kind of commitment as a complete album purchase. Without diluting the value of an actual album purchase, you’re getting partial credit for it. That’s where folks often screw up when looking at raw download numbers.
But streaming changes the equation entirely. Where albums is concerned, it’s the volume rather than price that counts: In the US, the RIAA divides its stream count by 1,500 on-demand plays per album. In other parts of the world, the divisor vary (in the UK), for example, the number is estimated at 1,000 streams per album. Those figures aren’t just plucked out of thin air. They’re based off years of listening experience and playlist habits of fans.
To see how a project would fare across different certification rules, the calculator allows you to select between those reporting models. Going from the US chart model to the UK estimate can swing your numbers by quite some margin; something to bear in mind if you’re thinking of rolling this out internationally.
And then there’s certification, which is where many of these plans stall. To get Gold status in the U.S., you’d have to sell or stream 500,000 units; for Platinum, a million. At that point, it’s easy to assume all you need to do is get more folks listening. The truth is you’ll likely need to combine the right mix of consumption sources. Under today’s chart splits in the U.S., an all-premium subscriber-driven campaign would require approximately half the amount of plays compared than an all-ad-supported-streaming project. Why? Because that change the denominator. And if you ignore this, you’ll overestimate how far along you are.
Then there’s one more element of complication spreadsheets don’t typically account for: Territory eligibility. Your global smash doesn’t necessarily factor into a local award. Your streaming numbers get dropped if they hail from a region outside a particular certifying organization area. Before crunching the numbers, the calculator lets you plug in an eligible territory portion percentage. This slight refinement ensures that when you realize you’re just inches away from hitting Gold… You’ll discover half your fan base isn’t counting towards your total. It makes you take a practical assessment of how many people you’ve actualy reached in vital territories.
Playing the long game matters because viral moments gets a lot of attention, but sticking power wins out. Catalog albums continue to rack up consistent streaming plays and the occasional physical sale. These numbers adds up to cross thresholds that launch week spikes don’t. The reference tables on the page lay out typical scenarios ranging from the major label debut to the indie campaign. They illustrate how various combinations of consumption factors plays into the ultimate score. This shows the trade-offs you need to consider when deciding how much to spend on playlist pitching versus pushing for physical merch bundles.
Knowing how many ratios exist isn’t necessary to handle a release well. Knowing what actualy impacts your desired outcome is all that matters. It’s one thing to aim for a RIAA plaque or even a Billboard chart placement; it’s another to understand how the same mathematical equation apply to both. What goes into this is honesty, and what comes out is clear. And that’s kind of the whole point of measuring consumption in the first place.
After the dust has cleared and the charts have updated, knowing exactly where each and every unit originated will make celebrating that much sweeter, instead of wondering if it was luck. You should of known more earlier.