Antinode Position Calculator
Locate standing-wave antinodes along a room axis, air column, or string span, then compare the nearest peak with a microphone, listener, instrument, or measurement point.
Pick a practical music or audio scenario, then adjust the span, mode, boundary model, temperature, and target position. Positions are measured from the selected reference end.
Calculation Breakdown
| # | Position From Reference | Position From Other End | Target Distance | Status |
|---|---|---|---|---|
| Run the calculator to list the active antinode positions. | ||||
Sound or wave speed
Effective span
Effective harmonic
Antinode count
| Model | Typical Audio Use | Pressure Antinodes | Displacement Antinodes |
|---|---|---|---|
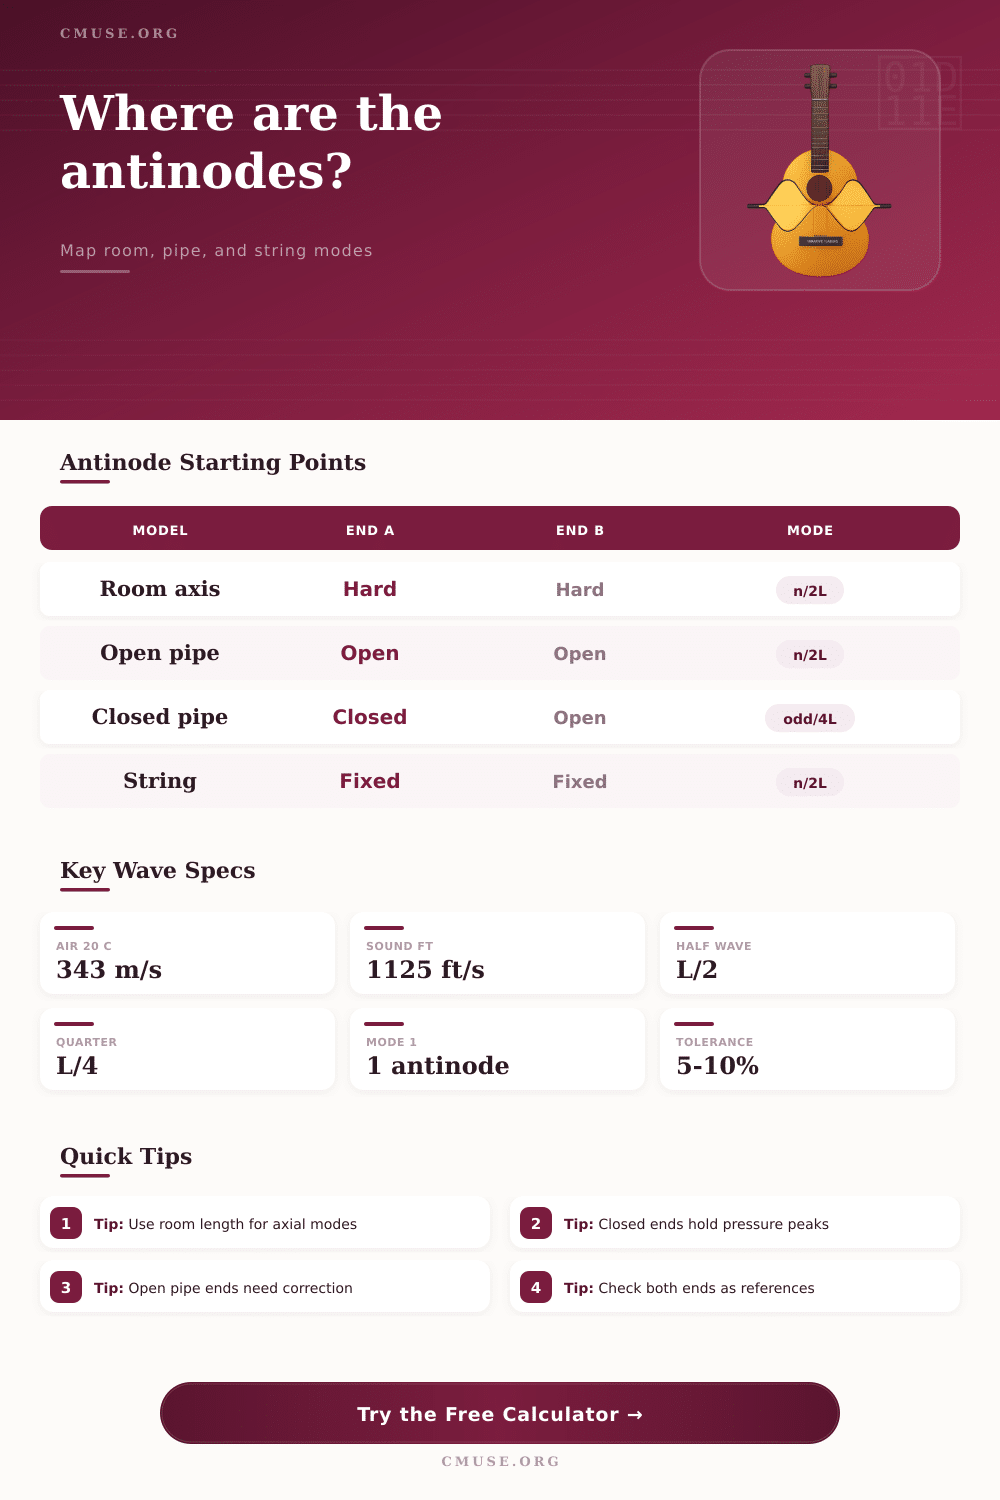
| Room axis | Axial room modes between hard boundaries | x = kL/n, including both walls | x = (k + 0.5)L/n between wall peaks |
| Open-open tube | Flute-like air columns and open ducts | x = (2k + 1)L/(2n) | x = kL/n, including open ends |
| Closed-open tube | Clarinet-like bores and stopped pipes | x = 2kL/q for odd q | x = (2k + 1)L/q for odd q |
| Fixed string | String harmonics between nut and bridge | Not the normal string view | x = (2k + 1)L/(2n) |
| Scenario | Span | Likely Mode | Antinode Planning Note |
|---|---|---|---|
| Small vocal booth length | 5-8 ft | 70-115 Hz | Pressure peaks collect at hard boundaries. |
| Home studio width | 9-12 ft | 47-63 Hz | Side-wall peaks repeat every half wavelength. |
| Practice room height | 8-10 ft | 56-70 Hz | Floor and ceiling are first-mode pressure peaks. |
| Open instrument tube | 1-3 ft | 180-560 Hz | Pressure peaks sit inside, not at the open ends. |
| Guitar speaking length | 24-26 in | String modes | Displacement peaks fall between fixed endpoints. |
| Band | Approx Range | Antinode Concern | Useful Check |
|---|---|---|---|
| Sub bass | 20-60 Hz | Room-length peaks dominate | Map wall and corner pressure zones. |
| Bass | 60-120 Hz | Axial modes stack quickly | Compare seat and mic positions. |
| Low mids | 120-300 Hz | Higher modes create closer peaks | Check repeated spacing, not one point. |
| Instrument bore | 200 Hz-2 kHz | End conditions move peaks | Use open-end correction for tubes. |
Your room also has standing waves that form peaks and valleys of air pressure. That is what makes bass notes sound muddy or tight. Many people assume bass problems are due to absorption, but it’s really a geometry problem. Adding foam doesn’t fix a mode. It fixes nothing until you know actualy where the energy concentrates. That’s why knowing your room size isn’t as important than mapping out antinodes.
This leaves the math up to the calculator. Boundary conditions describes what happens when a sound wave bounces off a surface in a specific space. Examples include the room axis model and the open pipe model. If it is a hard wall the pressure will reflect fully which causes a peak to form on the boundary side. Open ends free the air to flow through so you get a node instead. You input these boundary conditions and your span length into calculator, which does all the work for you when mixing.
Where Bass Gets Stuck in Your Room
These figures take into account that temperature does affect them as the sound travels slower through cold air then warm. Why? Because warmer air is less dense. The pressure waves move quicker through warm air. This results in a slight shift in fundamental frequency from January to July. This is accounted for by allowing you to manually enter wave speed or select temperature. A little thing, but if you are checking for harmonic resonance or chasing precise phase alignment then it matters.
Most engineers hangs up on pressure versus displacement antinodes. We typically want to know where the pressure peaks are in a room. Those is what our ears hear and mikes pick up as loudness. The lowest modes has their pressure peaks at hard boundaries. But string instrument has its ends fixed so they’re displacement nodes. It’s what’s in-between that you’re hearing when it sounds good. A little knowledge of where you want your microphone will keep you from putting it there.
Jump to common scenarios with a simple press off one of the preset buttons. Examples being width of the control room, vocal booth etc. From there, the presets provides a starting point for axial modes. In small spaces, axial modes is the loudest reflections. Once you’ve set your positions, compare them from your listening spot. You’ll notice if you’re sitting on a node, the sound dissapears completely. Or if you’re sitting on a pressure peak, then that frequency will be boomy. Neither location reflect what the real average response of the room is.
Tolerance is how far from a peak you want to consider it a peak. What is “on” a peak? Heads and speakers has width. The reality of the situation isn’t often a single, exact, moddern mathematically precise point. This is where tolerance comes in. Five percent tolerance lets you draw a practical zone to hit or avoid. It makes abstract math something you can see on your floor plan. It helps you see where these zones are before you buy traps or move furnitures.
Other nuances include effect of open ends on air columns such as those in flutes. Waves do not cease precisely on the edge of rim. The air outside has some inertia. There is no reason why the surrounding air should of not. In effect, this increases the tube’s length. With a tiny adjustment called a correction factor, they adjusts wavelength closer to real world. It is less significant when considering a room, but more important when dealing with duct work or musical instruments. It fills the theoretical-measurement gap.
There are axial, tangential, and oblique modes which is three dimensional. It creates a complex web of interference. The numbers I’ve presented here represent the skeleton of what happens in a room. From now on, you must listen and measure. Use this set of peak locations as a starting point for placement then confirm with data. Knowing about pressure will help determine where to position subwoofers or stand to get the smoothest response.