Intermodulation Frequency Calculator
Calculate two-tone and three-tone intermodulation products, locate in-band spurs, fold products through a digital sample rate, and compare spacing against audio, wireless, and RF guard bands.
Choose a real measurement or frequency-planning scenario, then adjust the tones, product order, bandwidth, and sample-rate folding. Frequencies may be entered in Hz, kHz, or MHz.
Calculation Breakdown
2-Tone Product
fIM = |m f1 +/- n f2|, with order = m + n
3-Tone Product
fIM = |a f1 + b f2 + c f3|, order = |a| + |b| + |c|
Alias Fold
fAlias = |((f + Fs / 2) mod Fs) - Fs / 2|
Guard Margin
margin = minimum distance from product to each wanted tone
| Formula | Order | Product | Alias | Nearest wanted | Status |
|---|---|---|---|---|---|
| Run the calculator to list the closest products. | |||||
| Order | Common form | Why it matters | Typical severity |
|---|---|---|---|
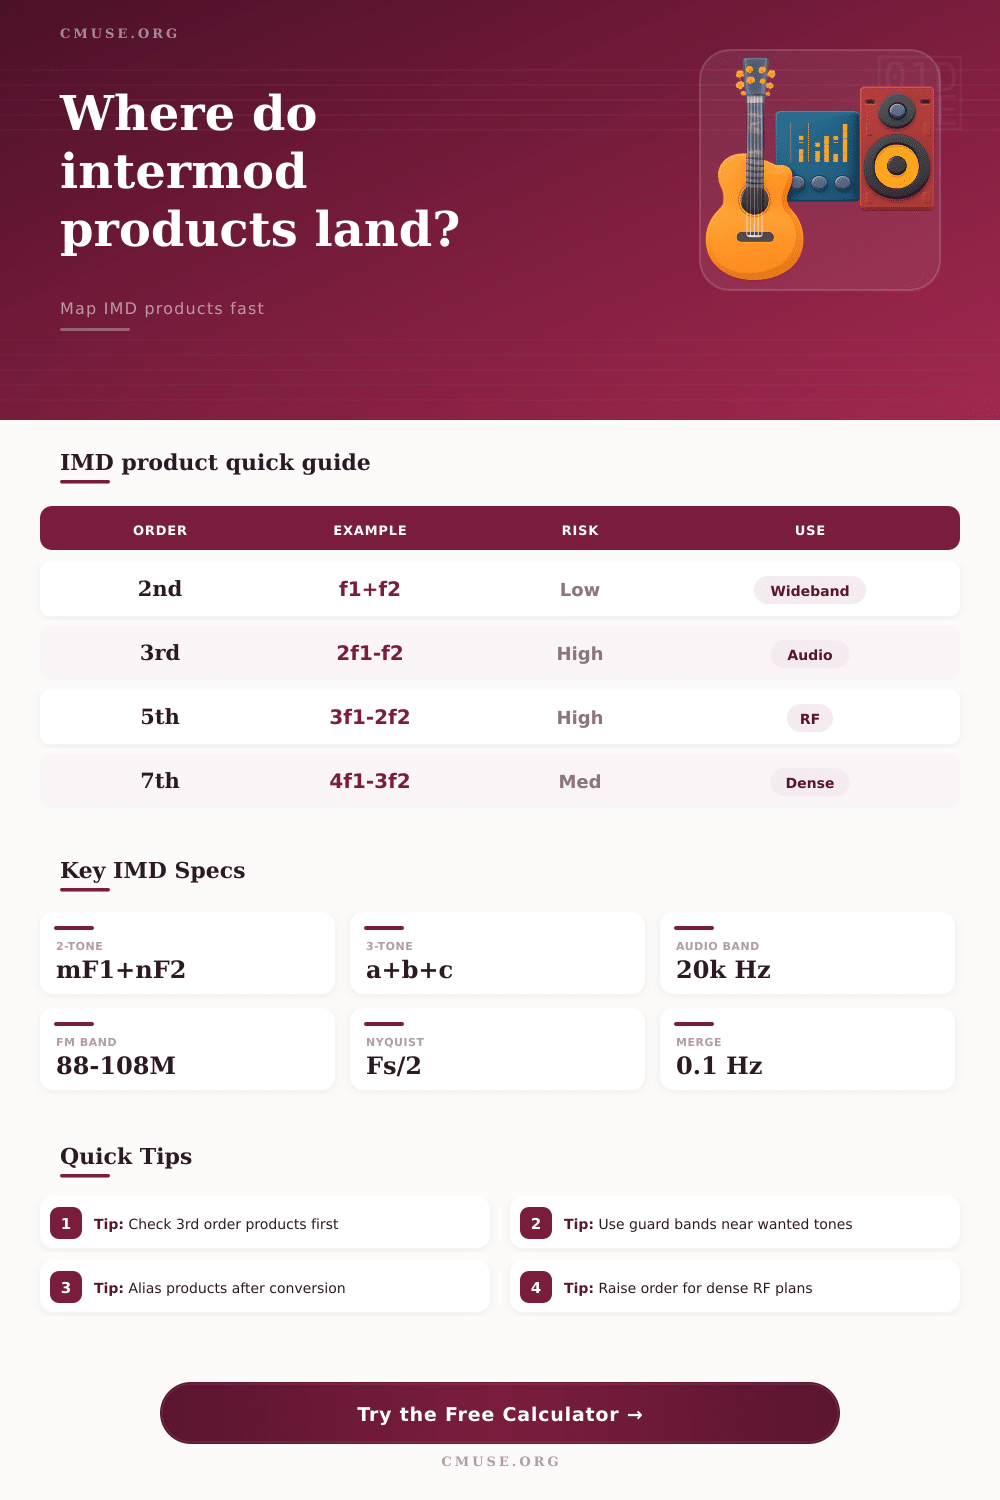
| 2nd | f1 + f2, |f2 - f1| | Can create sum, difference, and low-frequency beat products. | Usually easier to filter unless it lands inside the passband. |
| 3rd | 2f1 - f2, 2f2 - f1 | Often lands close to the original tones and is hard to filter. | High priority in RF coordination and audio linearity tests. |
| 5th | 3f1 - 2f2, 3f2 - 2f1 | Appears near wanted channels when devices are driven harder. | Important for dense wireless and wideband front ends. |
| 7th | 4f1 - 3f2, 4f2 - 3f1 | Lower amplitude than 3rd order but still relevant in crowded plans. | Medium risk unless spacing is very tight or levels are high. |
| 9th | 5f1 - 4f2, 5f2 - 4f1 | Useful for conservative checks on many-carrier systems. | Usually low amplitude, but worth reviewing near receivers. |
| System | Useful band | Product concern | Planning note |
|---|---|---|---|
| Audio converter test | 20 Hz to 20 kHz | Difference tones and folded ultrasonic products. | Check the alias column when tones exceed Nyquist. |
| FM broadcast receiver | 88 to 108 MHz | Strong adjacent transmitters can create in-band IM3. | Use protected band low/high around the receiver range. |
| Wireless microphone block | 470 to 608 MHz | Third and fifth order products between assigned carriers. | Guard products away from active channel center frequencies. |
| IEM transmitter rack | 470 to 698 MHz | Combining several transmitters raises composite IMD risk. | Use conservative order settings for dense show files. |
| HF or VHF receiver | System dependent | Out-of-band blockers can mix into the tuned channel. | Include blocker frequencies even when they are outside the passband. |
| Preset | Tones | Band | Primary result to watch |
|---|---|---|---|
| Audio 19 kHz + 20 kHz | 19 and 20 kHz | 0 to 24 kHz | 1 kHz difference tone and ultrasonic alias products. |
| Guitar Pedal 700 + 1900 | 700 Hz and 1.9 kHz | 20 Hz to 20 kHz | In-band musical IM3 products around 500 Hz and 3.1 kHz. |
| UHF Wireless Trio | 521.2, 523.8, 526.4 MHz | 520 to 528 MHz | 3-tone products near assigned carriers. |
| FM Broadcast Check | 94.7 and 99.5 MHz | 88 to 108 MHz | 2f1 - f2 and 2f2 - f1 landing inside the FM band. |
| ADC Alias Stress | 21 and 23 kHz | 0 to 24 kHz | Products above Nyquist folding back into audio. |
| Synth Oscillator Pair | 440 and 660 Hz | 20 Hz to 20 kHz | Harmonic-related products that can mask intentional partials. |
| Use case | Small guard | Moderate guard | Conservative guard |
|---|---|---|---|
| Audio distortion testing | 10 Hz around tone | 50 Hz around tone | 100 Hz around tone |
| Synth or instrument analysis | 5 Hz around partial | 20 Hz around partial | 50 Hz around partial |
| Wireless microphone carrier | 25 kHz from center | 100 kHz from center | 250 kHz from center |
| FM broadcast receiver | 100 kHz channel edge | 200 kHz channel spacing | 400 kHz local-clear margin |
| Wideband RF front end | 1 percent of span | 2 percent of span | 5 percent of span |
Why is it that you have several wireless mics on stage and live sound system sounds weird? You may not care about intermodulation from an RF engineering standpoint, but they’re no theoretical phenomenon. Mixers and amplifiers will produces frequency components that didn’t originate in the source signal. In other words, phantom tones can mess up your critical communications channels or any audio. The calculator above does the math for you, but knowing what causes them to occur help you solve the issue before it blows up your show.
Begin by adding your primary and secondary tones. A common misconception here is that widely spaced frequencies won’t interfere with each other. Unfortunatly, third order results (for example: two times one tone minus another) will tend to end up near original tones no matter how far apart they are. Because these occur in the passband where you desire clean signal, they’re hard to eliminate with filters like high- or low-pass. The solution doesn’t live next to your voice; it’s not something you can easily filter away.
How to Fix Weird Sound Problems
For complicated wireless mics and IEM rigs, two tones isn’t sufficient to account for all the interactions. A third tone adds products like one plus two minus three. They might be below second-order distortion products but show up at precisely the frequencies that is problematic. The tool has options to turn on this mode and set maximum product order to consider. If you have lots of channels in a given frequency block or if your system is pushed hard, higher orders will makes a difference.
Planning is where it all starts with guard bands. Even when two products don’t quite overlap, setting a conservative margin around desired tones will flag items that fall within the margin. Because human hearing tends to merge adjacent frequencies, a modest guard band is sensible for audio use. But larger margins are necessary for RF applications, to avoid desensitizing receivers. The table below (on page) show suggested spacings for common uses. Use this as a starting point for what’s reasonable to expect from your own gear.
Aliasing adds another wrinkle to digital conversion. Intermodulation products at or above one-half the sample rate fold back in on themselves. This becomes either ultrasonic noise (noise above human hearing) or distortion in the midrange. That’s all invisible until post-analog-to-digital conversion. The alias column points out hidden risks that even traditional frequency planning totally overlooks. It is a minor point but a significant one when fidelity is most important, whether you’re broadcasting or simply recording audio.
What it shows are the worst offending order and the corresponding close-in spurs. So then you know if it’s simple harmonics mixing (basic problem) or something more complicated like nonlinear effects. Are there a lot of third-order products? It is time for some more linear components in that front end. Are there lots of high orders? Maybe time to add some more filters or reduce drive level. In real life you should of balance those requirements with what equipment you have, what bandwidth you want to use etc.
Intermodulation management is an exercise in anticipating chaos. By plotting out where those ghostly frequencies show up, you can take command of a system that would seem to have no predictability at all. It’s simple math but with serious consequences for signal integrity. Knowing what you cannot see. The invisible interference that comes through your receiver input or your ear, makes all the difference between clean audio and garbled conversation.