Converter dBFS Reference Calculator
Calculate how a converter alignment maps dBFS to analog dBu, dBV, RMS volts, peak volts, full-scale capability, and remaining headroom for audio interface calibration.
Pick a common studio, broadcast, live, or consumer alignment. Each preset fills the digital reference tone, nominal analog level, converter full-scale target, bit depth, and expected signal crest factor.
Calculation Breakdown
dBFS To Analog Level
Once full-scale dBu is known, any digital reading maps directly by level difference.
dBu = FS dBu + dBFS
dBu To RMS Volts
dBu uses 0.775 volts RMS as its reference, independent of impedance.
Vrms = 0.775 x 10^(dBu / 20)
Reference Headroom
Analog headroom is the difference between the converter full-scale level and nominal level.
Headroom = FS dBu - Nominal dBu
Peak Margin
Crest factor estimates how close an RMS or average signal peak gets to digital clipping.
Margin = 0 - (dBFS + crest)
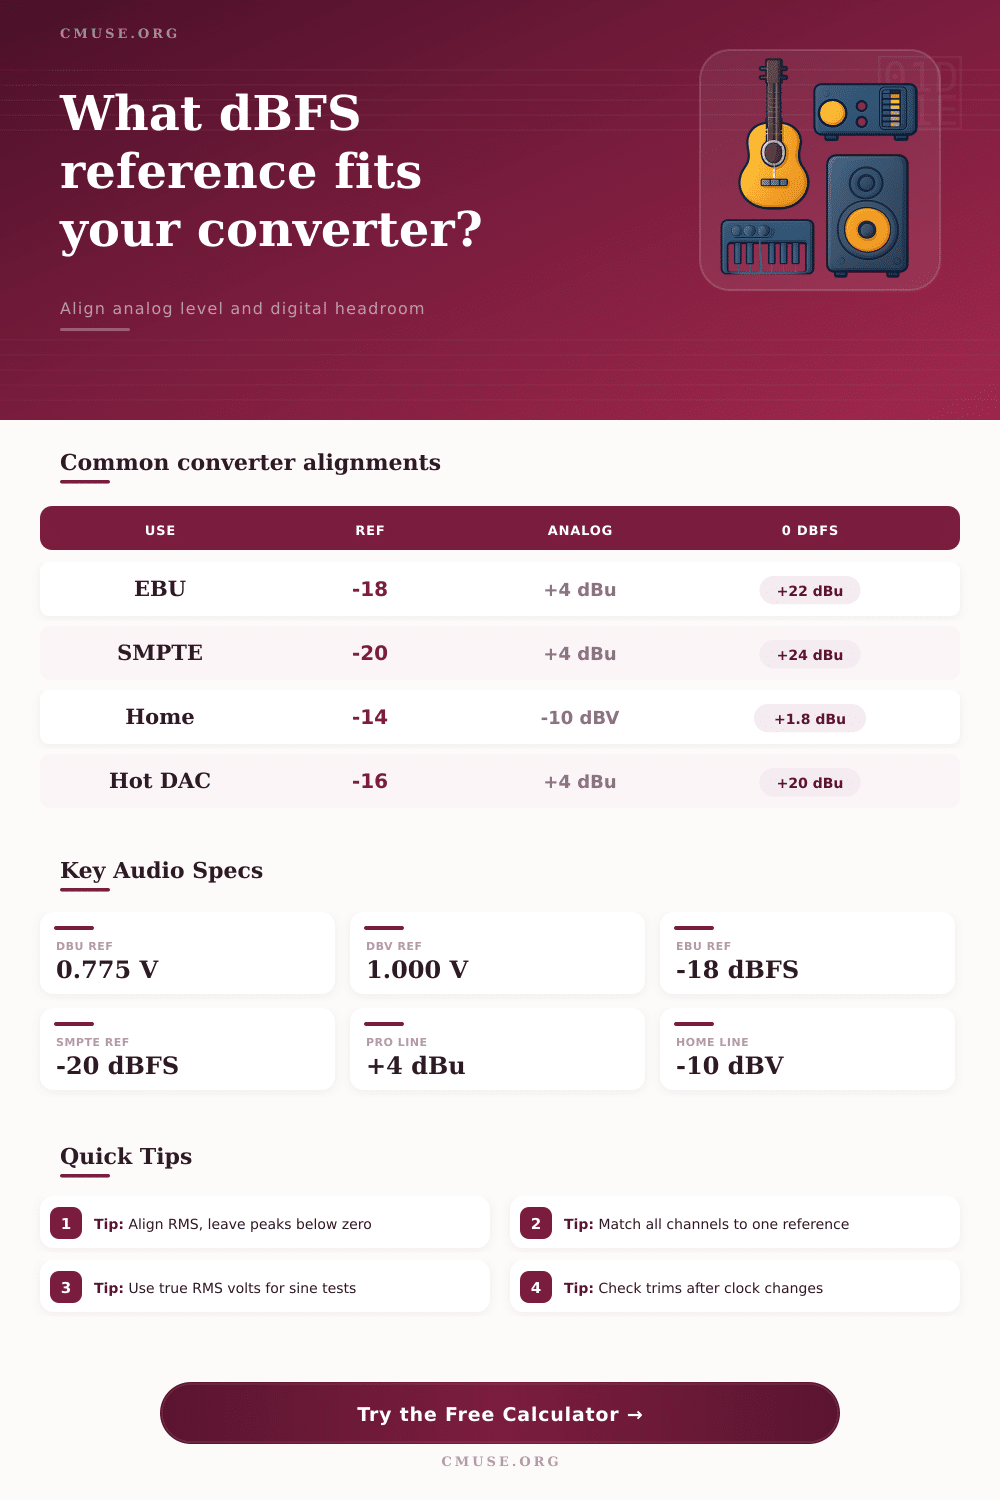
0.775 V
0 dBu RMS reference
1.000 V
0 dBV RMS reference
+4 dBu
Professional nominal line
-10 dBV
Consumer nominal line
-18 dBFS
Common European alignment
-20 dBFS
Common US film alignment
+22 dBu
Typical pro full-scale output
+24 dBu
High-headroom converter target
| Alignment | Reference Tone | Nominal Analog | Full Scale Analog | Typical Use |
|---|---|---|---|---|
| EBU style | -18 dBFS | +4 dBu, 1.228 Vrms | +22 dBu, 9.76 Vrms | Music studios, European broadcast, balanced line calibration. |
| SMPTE style | -20 dBFS | +4 dBu, 1.228 Vrms | +24 dBu, 12.28 Vrms | Film, post production, and rooms expecting extra peak clearance. |
| ATSC loudness | -24 dBFS | +4 dBu, 1.228 Vrms | +28 dBu, 19.46 Vrms | Broadcast metering workflows with conservative digital reference. |
| Project studio | -16 dBFS | +4 dBu, 1.228 Vrms | +20 dBu, 7.75 Vrms | Interfaces, monitor controllers, and compact analog chains. |
| Consumer line | -14 dBFS | -10 dBV, 0.316 Vrms | +1.78 dBu, 0.95 Vrms | Synths, recorders, hi-fi inputs, and unbalanced line devices. |
| Analog Level | dBV Equivalent | RMS Volts | Peak Volts | Peak-to-Peak |
|---|---|---|---|---|
| -10 dBV consumer nominal | -10.00 dBV | 0.316 Vrms | 0.447 Vpk | 0.894 Vpp |
| 0 dBu reference | -2.21 dBV | 0.775 Vrms | 1.096 Vpk | 2.192 Vpp |
| +4 dBu pro nominal | +1.78 dBV | 1.228 Vrms | 1.737 Vpk | 3.474 Vpp |
| +18 dBu interface output | +15.79 dBV | 6.156 Vrms | 8.706 Vpk | 17.41 Vpp |
| +24 dBu high headroom | +21.79 dBV | 12.28 Vrms | 17.37 Vpk | 34.74 Vpp |
| Digital Reading | At +22 dBu FS | At +24 dBu FS | Peak Risk | Use Case |
|---|---|---|---|---|
| -24 dBFS | -2 dBu | 0 dBu | Very low | Broadcast tone, calibration safety, dialog averages. |
| -20 dBFS | +2 dBu | +4 dBu | Low | Film reference, large dynamic range, post rooms. |
| -18 dBFS | +4 dBu | +6 dBu | Low | Music recording alignment and analog insert calibration. |
| -12 dBFS | +10 dBu | +12 dBu | Medium | Hot mix stems or steady electronic instruments. |
| -6 dBFS | +16 dBu | +18 dBu | High | Near-peak material; verify analog output headroom. |
| Scenario | Reference | Full Scale | Nominal Voltage | Practical Check |
|---|---|---|---|---|
| Balanced studio interface | +4 dBu at -18 dBFS | +22 dBu | 1.228 Vrms | Send a 1 kHz sine and trim each channel to the same RMS meter reading. |
| Film mix stage converter | +4 dBu at -20 dBFS | +24 dBu | 1.228 Vrms | Confirm that pink noise and tone agree with room monitoring reference. |
| Analog mastering chain | +4 dBu at -18 dBFS | +24 dBu | 1.228 Vrms | Leave analog insert return peaks below clipping after makeup gain. |
| Unbalanced synthesizer capture | -10 dBV at -14 dBFS | +1.78 dBu | 0.316 Vrms | Pad hot outputs if square waves or resonant filters exceed the margin. |
| Hi-fi DAC measurement | 2 Vrms near 0 dBFS | +8.24 dBu | 2.000 Vrms | Use a sine file below full scale if the output clips at 0 dBFS. |
The other way to have a heart attack is having everything look okay on the digital wave form but seeing it all distorted on the analog output. What gives? Well, despite the similarity of the names, digital full scale and analog maximum output aren’t the same value. Just because something appears “zero” decibels or lower on-screen doesn’t mean it’s safe; it’ll bite you.
This calculator take your digital reference and converts it to actual voltage so you can visually determine whether your converter provides enough head room to accommodate any transient peak. Why? Because understanding the conversion lets you know your gear’s physical limits without looking up values in tables.
Why Digital Levels Can Distort Your Analog Sound
First select a preset that fits your workflow. The EBU standard is -18 dBFS +4, which gives you 22 dB of headroom before clipping in the computer. SMPTE adds another ten and runs at minus twenty. This give a bit more wriggle-room for film mixing or when dialogue need some breathing space, since it is impossible to predict dynamic peaks. That gives you an additional margin to ensure those orchestral hits or drum crescendos don’t come as a surprise by causing distortion.
Presets only get you halfway there; adjusting the input crest factor is where things really start to make sense. The crest factor are 15 dB. The problem is that most music is far from a constant sine wave. There are peaks that will spike well beyond average level of the music. Your mix may be sitting at minus twelve decibels FS on your RMS meter. However, the crest factor is fifteen decibels. This mean your transient peaks are already reaching digital zero.
Your meter shows green bars and all appears okay but it’s tighter than it seems. This crest difference is included in the calculator to show the risk. Since most DAW meters don’t show where the true peaks are hiding, the calculator let you know how much room you have between the nominal level and the unexpected spikes that often occur.
This is also where the analog voltage levels come into play. Consumer gear typically runs on -10 dBV, whereas professional interfaces typically expect +4 dBu at the nominal point. If you mix these without converting them, you will get harsh clipping or quiet/noisy recordings. The tool will convert automatically between dBV and dBu so you know what actual RMS voltage your converters are seeing. It’s good to be able to compare spec sheets across manufacturers, knowing that a +4 dBu level is about 1.2 volts.
Don’t forget to think about bit depth too. With a 24-bit system you have a huge amount of dynamic range and can get away with very quiet recording before running out of resolution. That’s why you’ll often see people using a reference lower than usual, down to minus twenty or even minus twenty-four, where they can pick up more detail during quieter sections.
With a sixteen bit system, there’s no margin for error; it require a hotter signal (before quantization noise becomes audible) so your reference tone will be closer to zero. That affects how much the calculator must push the threshold downward because there is less “floor” below it.
Aging components and changing temperatures cause calibration to drift. To keep things honest, run a sine wave through the chain and compare the output voltage to what you expect it should of been. When the analog meter reading is above what you see on your digital input, you have an effective hotter-than-configured system. You’ll experience unexpected clipping downstream.
Write down the nominal analog voltage and reference tone level of each interface used along with its full scale headroom so this info stays simple as you document them. That way, when you bring in new gear or take your sessions to another studio, hours of troubleshooting gain staging issue are avoided.
When it comes to getting converters aligned, the goal is consistency and alignment. It’s more a question of being consistant. Flying blind means your digital readout doesn’t necessarily match with how things sound in the room. Ideally, you want what you see on the screen to match what’s happening physically with your outboard gear.
After proper reference points have been set, the anxiety over blowing out unexpectedly goes away. And you start trusting your meters again. Instead of looking at your numbers, you’re livig for the music.