Signal Averaging SNR Calculator
Estimate how repeated captures improve signal-to-noise ratio when random noise averages down, then see how correlated hum, drift, jitter, clipping, and rejection choices reduce the real-world gain.
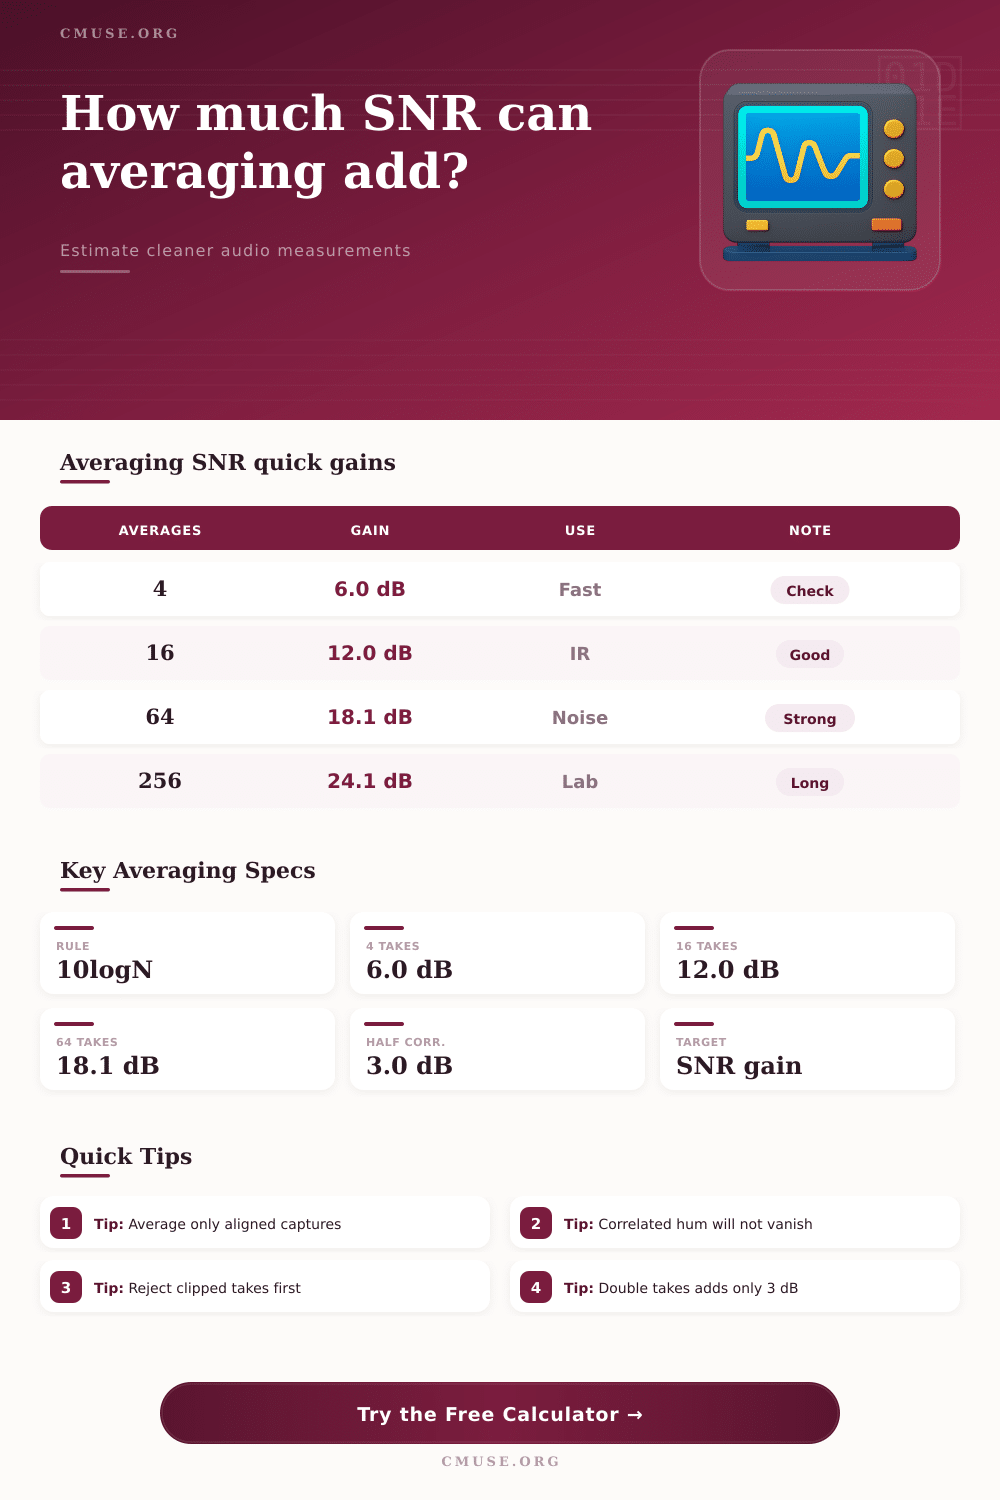
Choose a measurement scenario to load realistic starting values. The core averaging rule is 10 log10(N), but the calculator applies penalties when the noise is not fully random or the takes are not perfectly repeatable.
Formula Breakdown
| Averages | Ideal gain | Noise amplitude left | Best fit |
|---|---|---|---|
| 2 | 3.01 dB | 70.7% | Quick stereo repeat, rough noise check, or instant analyzer smoothing. |
| 4 | 6.02 dB | 50.0% | Fast room sweep verification when time is limited. |
| 8 | 9.03 dB | 35.4% | Portable measurements with moderate repeatability. |
| 16 | 12.04 dB | 25.0% | Impulse response, transfer function, and mic preamp tests. |
| 32 | 15.05 dB | 17.7% | Cleaner low-level detail without an overly long capture session. |
| 64 | 18.06 dB | 12.5% | Noise floor studies, quiet decay tails, and lab-style audio checks. |
| 128 | 21.07 dB | 8.8% | Long repeatable tones where drift stays controlled. |
| 256 | 24.08 dB | 6.3% | Stable bench testing with synchronized playback and capture. |
| Method | Efficiency used | Strength | Watch point |
|---|---|---|---|
| Linear mean | 100% | Maximum SNR gain for independent Gaussian noise. | Vulnerable to clicks, pops, and accidental bumps. |
| Trimmed mean | 92% | Good balance for occasional outliers in repeated audio captures. | Slightly less gain than a clean arithmetic mean. |
| Median stack | 64% | Rejects rare impulses and nonmusical transients well. | Needs more takes for the same noise reduction. |
| RMS average | 55% | Useful for level trends, spectrum smoothing, and noise power views. | Does not cancel random waveform noise as efficiently. |
| Complex average | 98% | Excellent for phase-locked sweeps, IRs, and transfer functions. | Timing or phase drift quickly reduces high-frequency gain. |
| Issue | Calculator input | Why it matters | Typical symptom |
|---|---|---|---|
| Correlated noise | 0% to 99% | Repeatable noise does not average down like random hiss. | Hum line stays visible after many takes. |
| Level drift | dB peak-to-peak | Changing source or preamp level smears the repeated signal. | Averaged tone looks wider or unstable. |
| Alignment jitter | Samples RMS | High frequencies lose coherent addition when timing moves. | Top end dulls in the averaged impulse. |
| Rejected takes | Percent removed | Only accepted takes contribute statistical gain. | Less improvement than the planned take count. |
| Clipped takes | Percent clipped | Saturation creates deterministic distortion, not random noise. | Harmonics remain after averaging. |
| Confidence margin | dB reserve | Reporting margin prevents barely-passing SNR claims. | Target requires more repeats than ideal math. |
| Measurement | Usual averages | Primary result | Secondary check |
|---|---|---|---|
| Room impulse response | 8 to 32 sweeps | Cleaner decay tail and better low-level reflection detail. | Reject sweeps with chair noise, HVAC changes, or clipping. |
| Mic preamp noise test | 16 to 128 takes | Lower random meter scatter around the noise floor. | Watch mains hum because it stays correlated. |
| Speaker burst test | 4 to 32 bursts | Better waveform shape in noisy rooms. | Keep trigger timing tight for treble accuracy. |
| Tape or vinyl tone | 8 to 64 rotations | Reduced surface hiss around the repeated tone. | Wow, flutter, and eccentricity act like drift. |
| ADC linearity run | 32 to 256 frames | Improved visibility of low-level residuals. | Clock-related spurs do not average away. |
| Guitar DI reamp | 4 to 16 passes | Lower random room and pickup noise. | Performance or amp drift limits repeatability. |
It’s easy to know what I mean: you’re capturing a quiet source somewhere and the room refuse to stay silent. You get it to record; then you play it back and it’s white static, not your signal at all. This happens constantly with microphone preamps, vinyl rips, or acoustic sweeps. Despite its messy implementation, this is one of those things that turns out has fairly simple math for correction.
If you capture several samples of the identical sound, averaging them will cut down on the random noise, since the signal adds up consistently while the noise cancel itself out. It do so according to a clean logarithm: every time you double your number of average takes, you’ll have about 3 dB extra headroom. It is an elegant fix to a frustrating issue.
How to Make Your Audio Sound Cleaner
But here’s the rub: Life isn’t necessarily textbook formulaic. To use the calculator properly, you have to know how it help you during recording, which means knowing what it removes from the messiness of the process. Initially it presumes random normal noise, but then it makes deductions for those things that foul up the average in real life.
The biggie is correlated noise. If every single take contain some kind of mains hum, clock jitter, or a fan whine, you can’t get rid of it by averaging because that noise remains exactly lined up with your signal; adding more takes doesn’t help bury it. You may end up spending an hour making two hundred sweeps, but when you look it over the sixty-cycle hum is right there, unaltered and obnoxious. A common pitfall occurs when novice users assume that simple quantity fix their quality problems.
The other thing that’s just as important than the noise floor is aligning the timing. If you’re out of sync even slightly (a fraction of a sample) from take to take then that high frequency smear. Your waveforms are no longer lining up at their peaks and therefore they are not adding cleanly. Instead of something sharp, you get something soft and dull. That’s where the jitter comes into play on the calculator. It assume some amount of gain loss when your alignment is imperfect. So rushing the set up makes it look bad in a IR. Getting the time right is never negotiable if you’re going to stack and keep the top end bright.
And then there’s the question of bad takes. Chances are you’ve got some recordings with the gain clipping, or maybe somebody banged into the table and it made its way onto tape. Leaving that in your average will skew the result more than improve it. Better to simply throw them out. To do this, the calculator asks how many takes you want to discard, effectively reducing the number of averages applied to the math. If half your takes are garbage, you’re not going to get an extra six decibels. The page has some reference tables laying out these tradeoffs plainly.
They explain exactly why methods like median stacking protect against outliers but decrease efficiency. The choice of averaging method will also make a huge difference. The simplest linear mean provides the best theoretical noise reduction, but it is fragile because one large click can destroy an entire stack. A median or trimmed mean approach are safer for noisier environments by simply ignoring extreme values. That costs you some theoretical gain but yields a cleaner result in practice. In other words, there’s a balance between statistical purity and practical toughness that most field measurements will benefit from.
So in conclusion: Control. You need patience. Signal averaging isn’t magic. It’s not going to make something that shows up in every take of audio dissapear. First, get rid of the things that are consistantly correlated. Get rid of the hum. Stabilize your gain. Align your triggers. Let the random hiss go quiet. Then the math will reward you. Once you’ve got everything else under control, the numbers will just do their thing. Quietly. It is clear. A clean signal rise above the rest.