Series Notch Filter Calculator
Design a series RLC notch trap for speaker crossover work: target frequency, Q, impedance, L/C/R values, bandwidth, attenuation estimate, and driver breakup control.
Driver breakup presets
Notch design inputs
Calculation breakdown
Notch component grid
Frequency response estimate
| Frequency point | Trap impedance | Current share | Estimated attenuation | Breakup after trap |
|---|
L and C value grid
| Cap option | Required L | Actual f0 | Actual Q | Bandwidth | Use note |
|---|
Resistance, Q, and depth tradeoff
| Total R | Series resistor to buy | Q with current L/C | Estimated attenuation | Breakup result |
|---|
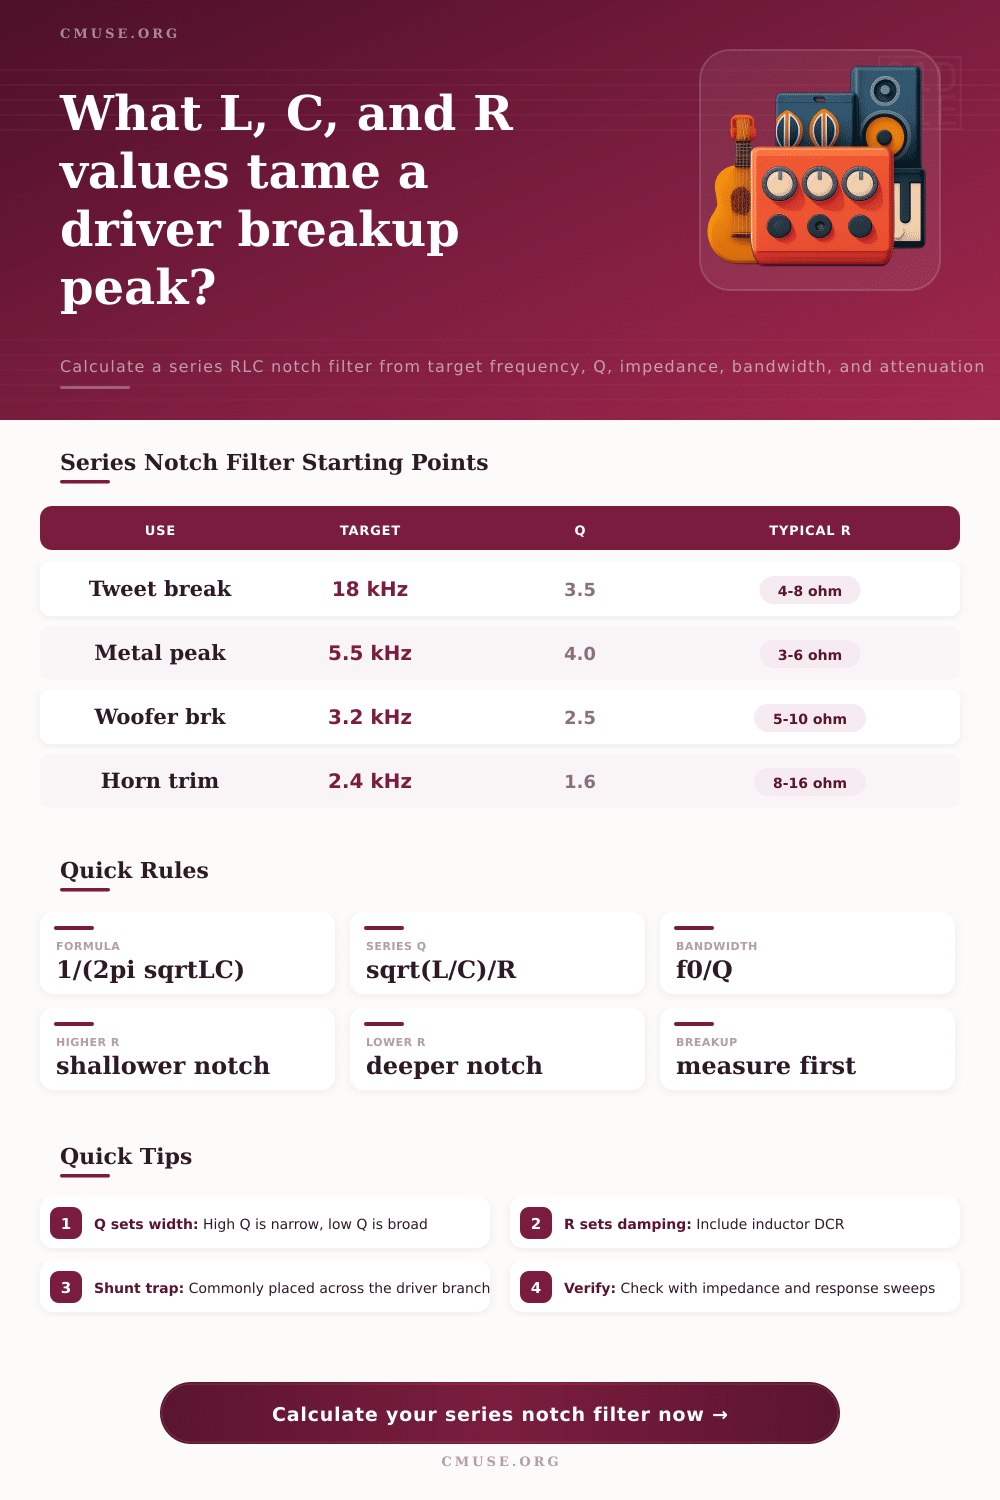
Breakup-control preset reference
| Preset | Target f0 | Q | Driver Z | Total R | Typical purpose |
|---|
Nearby rounded parts
| Part strategy | L | C | Resulting f0 | Q | Comment |
|---|
A speaker might sound good at low levels but become harsh and metallic at higher level. Chances are it’s not a crossover frequency issue. It is more likely a driver breakup mode where the cone or diaphragm stops behaving like a piston and begins to vibrate more like a drumhead, A series notch filter (RLC trap) tames this peak. It is not so much a cut of frequencies, but rather surgery to remove energy at a precise point without touching anything else.
Running math on the calculator above does that for you, but knowing why the numbers are relevant helps avoid some common pitfall. Resonance is what makes a notch filter work. It involve a combination of a capacitor, inductor and resistor in series. The capacitor and inductor combine to cancel their effects on one another at some specific frequency (called the resonant frequency). All that’s left is the resistive element to impede flow of current. If you connect this network in parallel (shunting) across your driver, then you have created a low-impedance path at that same frequency. This causes the amp to see a simpler load. It steals power from the speaker cone which makes response flat.
How to Fix Speaker Harshness with a Notch Filter
People miss this point. They mistakenly believe they’re blocking the sound. What you’re doing is offering an alternate path for electricity to travel.
Step one is getting center frequency correct. But it’s Q factor that will decide how narrow or wide your correction is. A high Q is like a surgical strike, only slicing through a razor-thin portion of the spectrum. A lower Q broadens the cut which, without care, can dull overall sound. In most cases, a breakup peak are a narrow affair that often calls for a Q in the three to five range. Making the notch too wide starts to eat into good portions of the driver’s range. The calculator does all the sizing work, but it’s up to you how aggressive to get with it based off the graphs from your measurements.
The art is in the resistance. Damping is controlled by resistor in the trap. The deeper and more intense notch come from the resistance value being lower and providing less opposition to current on resonance. There’s a limit though. You can get so low with the resistance that you end up loading down the amplifier or changing the phase response in unpredictable ways. It’s important to include the inductor’s DC resistance in the overall calculation. Coils are not perfect in the real world, They have internal wire resistance that becomes part of the damping network. If you ignore this underdamped traps won’t cut deeply enough.
Another variable involves driver impedance. At the frequency where the trap operates, the trap acts as a voltage divider with the impedance of the driver itself. Because the speaker’s impedance typicaly increases rapidly near its break-up freq (due to mechanical resonance), the trap has reduced leverage. To take that into account, the tool enables you to enter the measured impedance value at target frequency. The nominal eight-ohm label on the back of a box won’t help at all in this situation. What you need is the actual Z-theta value obtained via your sweep data. That makes a big difference in the resulting effective attenuation.
Location also plays a role. Ideally these traps are installed in-line parallel with driver but after any high pass/low pass filters are used to shape the signal. This way they will affect the desired portion only and not be on a slope of either filter. Begin with more resistance than the calculation says. The deeper notch can easily be achieved by reducing the resistance. Increasing is less so. That’s because if too much resistance is added then the sound becomes hollow and lifeless and you feel like driver isn’t part of the system anymore.
Last, check them. Real world drivers aren’t perfect; they have tolerances. An inductor might be plus or minus ten percent or worse. A capacitor moves with age and voltage. The chart shows how slight variations of C, L, or R impact result. Check your impedance curve. Find the peak. Plug it in. Make the trap. Test. If the ear doesn’t agree but the graph does, reduce the depth. As much as good crossover design involves taking things out, it also involves leaving things alone. You should of checked the math too.