Harmonic Distortion Percent Calculator
Enter the fundamental and harmonic amplitudes to compute THD percent, THD in dB, THD+N and the dominant harmonic – or convert a known THD percent straight to decibels
Full Calculation Breakdown
| Harmonic | Ratio Vn/V1 | dB Below Fund. | Character |
|---|---|---|---|
| — | — | — | — |
| THD % | THD dB | Description | Where Heard |
|---|---|---|---|
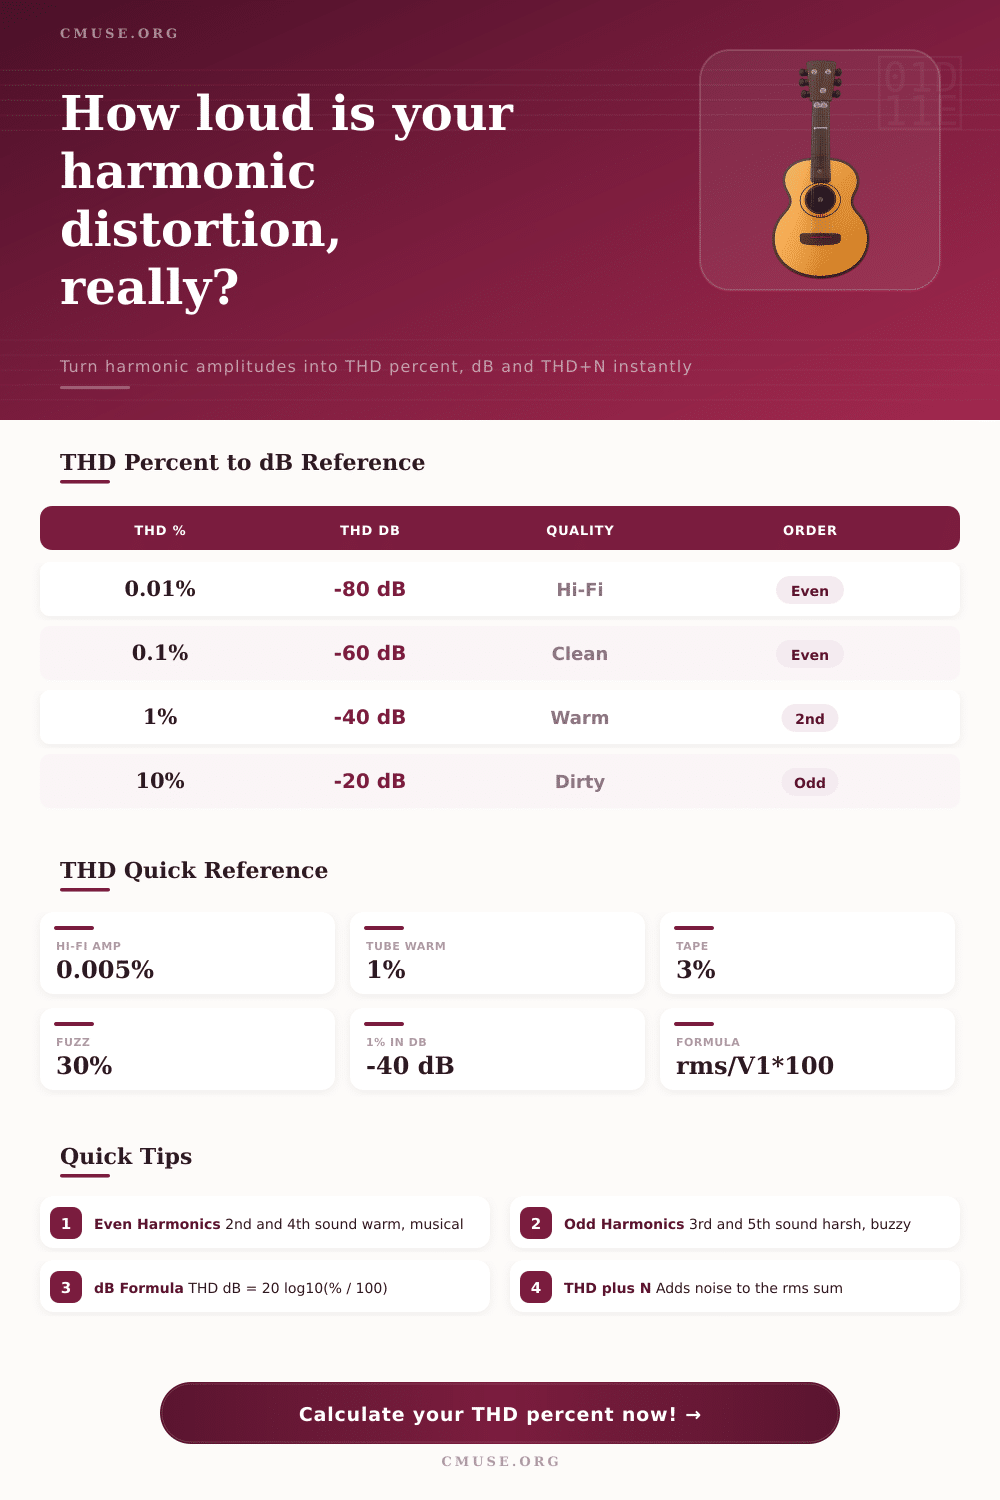
| 0.01% | -80 dB | Reference clean | Hi-fi DAC, measurement |
| 0.1% | -60 dB | Very clean | Pro console, interface |
| 1% | -40 dB | Audible warmth | Tube amp, transformer |
| 3% | -30.5 dB | Gentle saturation | Tape, light overdrive |
| 10% | -20 dB | Obvious distortion | Overdriven amp |
| 30% | -10.5 dB | Heavy clipping | Fuzz, full distortion |
| Harmonic | Type | Interval | Character |
|---|---|---|---|
| 2nd | Even | Octave | Warm, full, musical |
| 3rd | Odd | Octave + fifth | Hollow, edgy, present |
| 4th | Even | Two octaves | Bright but smooth |
| 5th | Odd | Two oct + third | Harsh, buzzy, gritty |
| 6th | Even | Two oct + fifth | Adds sheen, sweet |
| Gear | Typical THD | In dB | Tonal Result |
|---|---|---|---|
| Hi-fi power amp | 0.005% | -86 dB | Transparent |
| Studio interface | 0.001-0.01% | -100 to -80 dB | Clean reference |
| Tube preamp | 0.5-2% | -46 to -34 dB | Warm, even harmonics |
| Analog tape | 1-3% | -40 to -30 dB | Saturated glue |
| Overdrive pedal | 5-20% | -26 to -14 dB | Crunchy, odd-rich |
| Fuzz pedal | 20-50% | -14 to -6 dB | Square-wave roar |
What is harmonic distortion? It’s a fancy-sounding word that’s actualy one of the secret ingredients to nearly all music. Harmonic distortion is why some speaker sound thin while others sound warm. This explains why a cheap plastic speaker doesn’t cut it and why vacuum tube amp has a warmth that does.
It’s about which harmonics are present and how loud they are compared to fundamental tone. Knowing that changes how you troubleshoot noise in your signal chain, how you mix your tracks, how you listen to gear. You don’t need an oscilloscope to know what’s up. You just have to understand the math behind it.
What is Harmonic Distortion?
What is coloration? What is clarity? After you’ve gotten your amplitude readings, the rest of hard work is done for you by the calculator (above). It will take your fundamental frequency‘s voltage/dB level and compare it with second, third, fourth, fifth, and sixth harmonics.
Why does this matter? Not all distortion are created equal. The second harmonic adds an octave up, which tends to sound full and musical. That’s what you hear when someone uses tape machine or vintage tube amps… The warmth of it all.
The third harmonic sits at an octave plus a fifth, which brings in an edgy, hollow character that can become gritty if left too loud. Most people assume all distortion is bad noise; they are mistaken. In many cases, it’s intentionally colored. The tool can separate them out so you can see exactly which order is dominating your signal.
So how do we input the numbers? It is simple enough if you understand what’s being measured. Enter voltage or dB levels of your main tone. Also, enter the measured levels (volts or dB) of each harmonic measured by an analyzer in linear mode. Switch to decibel mode if you are working with decibels relative to fundamental to avoid conversion errors.
You will now find the percentage of Total Harmonic Distortion produced by adding the squares of all those harmonic voltages, then taking the square root and finally dividing that result by the voltage of the fundamental. Switching back to linear, this figure represent the number of decibels below the fundamental. Engineers tend to think in percentages, while audiophiles tend to think in decibels. So having both figures is nice.
One percent of THD equals negative forty decibels. That’s a big drop in level and you can easily hear it as a warm sound. Drop it to 0.01 percent and you get minus eighty decibels, which is essentially transparent for most listening environment.
Consider the noise too. The Noise Floor is part of the calculation that generates the THD plus N number. That’s important when you’re looking at hi-fi systems where distortion could be imperceptible while hum or hiss overwhelms what else is coming through. Even with pristine harmonics, bad noise floor compromise signal quality.
By including the noise RMS in the harmonic total and then dividing, the calculator factors in this reality and provides you with a more realistic view of how something will sound. Distortion may be low but the noise levels can be so awful as to ruin quieter parts of a song. Knowing the two lets you know if it’s time to re-ground things or replace your amps.
The numbers have reference tables on the page to give some context. Less than 0.01 percent distortion is the goal of a clean studio interface. An overdrive pedal intentionaly pushes past 5 percent to create crunch. There is no right or wrong, just a target for the type of character desired.
If you’re designing your own system, this gives you insight into where your gear falls on the spectrum and can prevent mismatched expectations. You don’t want your monitoring equipment to color your mix with unwanted harmonics. And you don’t want those creative saturation plugins to inject harsh odd-order distortion when you were after something more like smooth even-order warmth.
Which one is spiking? That’s what the dominant harmonic points to. And that tells you which part of the whole is contributing most to it. It is a troubleshooting aid. When the second harmonic are elevated, suspect tubes or transformers running close to the edge. When the third harmonic spikes, examine digital buffers and preamp gain stages for any signal clipping.
A general feeling that something doesn’t sound right becomes a concrete tip-off to where the culprit might be hiding. Guessing which piece of gear or cable needs swapping gets replaced by isolating the issue.
In conclusion, harmonic distortion is about control. If you want lush saturation or clear transparency, the numbers allow you to make an informed decision. Use the calculator for the data, use your ears for the verdict.
First measure a known clean source, then measure some gear that you think has coloration. Increase the drive levels and see how the harmonic profile changes. You’ll start hearing what separates good distortion from bad noise. This distinction should of been worth more than a spec sheet could ever be.