Parametric EQ Q Value Calculator
Convert center frequency, bandwidth in hertz, octave width, gain, and filter shape into Q values, lower and upper EQ edges, proportional-Q behavior notes, and practical audio filter specs.
🎚Named EQ Presets
⚙Parametric EQ Inputs
📊Current EQ Spec Grid
📝Live Band Edge Table
| Quantity | Calculated Value | Formula | Mix Meaning |
|---|---|---|---|
| Calculate to update EQ band details. | |||
📐Q and Bandwidth Formula Table
| Known Values | Main Formula | Best Use | Watch Point |
|---|---|---|---|
| Center and Hz bandwidth | Q = f0 / BW | Measured edges, analyzer readouts, filter design | For audio bands, use geometric center when comparing octaves. |
| Center and octave bandwidth | Q = sqrt(2^N) / (2^N - 1) | Musical EQ width, 1/3 octave work, broad tone moves | Octave width is a ratio, not a fixed number of hertz. |
| Center and Q | BW = f0 / Q | Most DAW and digital console EQ settings | High Q creates narrow bands that can ring if boosted hard. |
| Edge frequencies | f0 = sqrt(f1 x f2) | Measured -3 dB points and band-pass references | Arithmetic midpoint is not the same as musical center. |
| Gain with proportional-Q | Effective Q rises with gain amount | Analog-style console EQ behavior | Exact curves vary by EQ model and plugin design. |
🎧Common Parametric EQ Q Values
| EQ Character | Typical Q | Approx Width | Common Gain | Practical Use |
|---|---|---|---|---|
| Very broad tone shaping | 0.4 to 0.8 | 1.8 to 3.5 octaves | 1 to 4 dB | Master bus lift, gentle warmth, wide vocal balance. |
| Standard musical bell | 0.8 to 2.0 | 0.7 to 1.8 octaves | 2 to 6 dB | Most channel EQ moves on vocals, guitars, keys, and drums. |
| Focused correction | 2.0 to 6.0 | 0.24 to 0.7 octave | -2 to -8 dB | Boxiness, honk, small drum overtones, bass room notes. |
| Surgical notch | 6.0 to 30+ | Under 0.24 octave | -3 to -18 dB | Feedback, whistles, ringing cymbal tones, specific resonances. |
| Shelf corner | 0.5 to 1.2 | shape dependent | 1 to 6 dB | Low shelf weight and high shelf air without harsh overshoot. |
⚖Filter Shape Comparison Grid
| Filter Shape | Q Meaning | Good Starting Point | Result Character | Best Fit |
|---|---|---|---|---|
| Bell / peak EQ | Controls width around center frequency | Q 1.0 to 1.6 | Balanced musical cuts and boosts | Most parametric EQ channels |
| Notch | Controls rejection width around one tone | Q 8 to 18 | Precise removal with less nearby damage | Feedback and resonance control |
| Low shelf | Controls transition steepness near corner | Q 0.6 to 0.9 | Gentle low-end weight or cleanup | Bass, kick, full mix balance |
| High shelf | Controls transition steepness near corner | Q 0.6 to 0.9 | Air, brightness, or darkening | Vocals, overheads, master bus |
| Band-pass reference | Q equals f0 divided by pass-band width | Q 0.7 to 3 | Isolates a defined frequency region | Filter design and analyzer checks |
📋Preset Comparison Table
| Preset | Center | Q or Width | Gain | Why It Fits |
|---|---|---|---|---|
| Vocal Mud Cut | 250 Hz | Q 1.4 | -3 dB | Moderate-width cleanup without thinning the whole low midrange. |
| Snare Ring Notch | 720 Hz | Q 8.5 | -7 dB | Focused enough to reduce a ring while leaving shell tone nearby. |
| Kick Thump Boost | 63 Hz | 1.2 oct | +4 dB | Wide boost for weight that avoids a single-note low end. |
| Bass Room Mode | 47 Hz | Q 5.5 | -6 dB | Targets a room peak while preserving adjacent bass notes. |
| Master Air Lift | 12000 Hz | 2 oct | +1.5 dB | Broad enough for smooth brightness rather than a sharp whistle. |
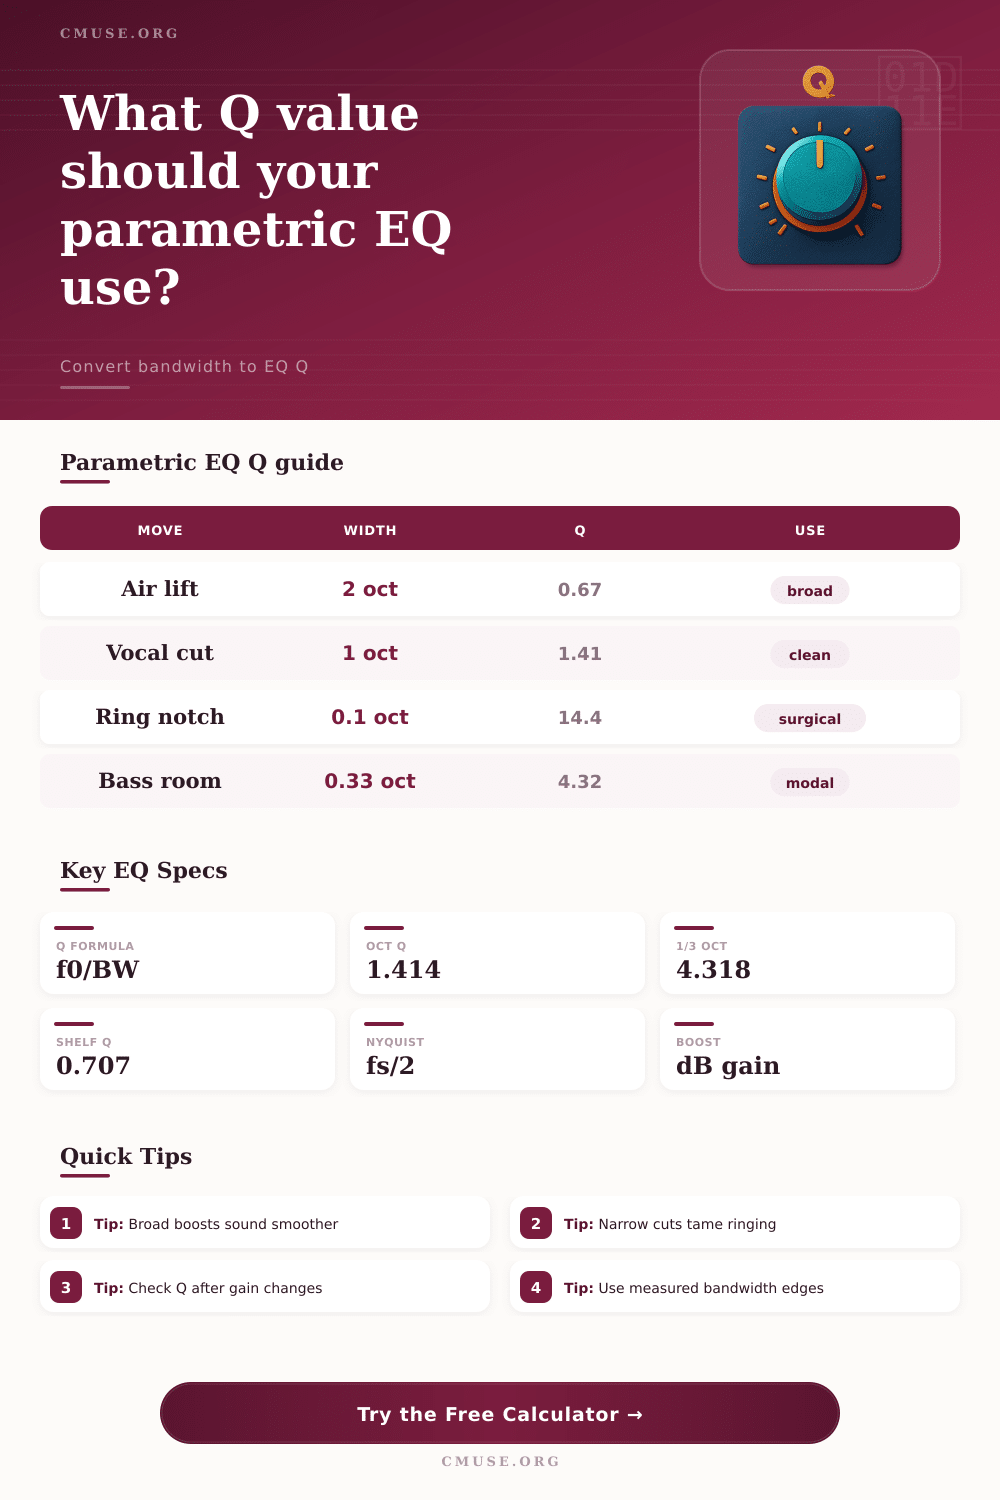
Parametric EQ allow a person to adjust the specific frequencies being played by choosing a center frequency and gain amount. The Q value can control the widths of the frequencies that will be changed, which measure the width of the band of frequencies that will be changed. The Q value is important in that it determine whether the sound of the frequency adjustment will sound natural or artificial.
Dividing the center frequency by the bandwidth calculates the Q value. The higher the Q value, the more narrow the bandwidth. A narrow bandwidth allow for better targeting of a specific frequency.
How Q and Bandwidth Change Sound in Parametric EQ
However, because of the narrow bandwidth, one resonant frequency may continue to ring within the mix. A wide bandwidth is useful if the engineer want the selected frequencies to blend in with other sounds in the mix. However, with a wide bandwidth, it may not be possible to target the specific frequency having problems with the sound.
This principle apply to both boosting and cutting frequencies. By using a narrow cut, for instance, a person can remove the unwanted tone from the sound without effect the other frequencies. However, if the cut is not placed accurate, the cutting filter will also remove useful tones.
Mix engineers use a specific process for find the correct frequency for a cut or boost. A person can start with a wide Q value to find the correct frequency with which to make a cut or boost, after which the person can narrow the Q value to allow for a more precise adjustment of the sound. A calculator is helpful for carrying out these calculations.
Such a calculator can convert bandwidth from hertz, octave width to Q value for EQ plugins. Additionally, the calculator can display the upper and lower edges of the frequency band that will be boosted or cut. These displays allow for a better understanding of how the EQ settings compare to the analyzer settings for the sound clip in question.
Many analog style equalizers include a feature called proportional-Q behavior. This feature allow the width of the frequency band to be adjusted when the gain is changed. For example, moderate boosts will result in a wide bandwidth.
However, strong cuts will result in a narrow bandwidth, even if the Q value for the EQ plugin do not change. Because digital emulations of EQ may or may not have this feature, it is important to check the effective Q value settings after setting the gain. Otherwise, a person may be surprised when comparing EQ settings between different audio plugins or audio consoles.
The filter shapes will impact how the Q value function. For instance, a bell filter will use the Q value to determine the width of the frequencies around the center frequency that will be boosted or cut. A notch filter will also use the Q value to determine which frequencies around the center frequency will be rejected.
A shelf filter will use the Q value to determine the steepness of the boost or cut filter and the amount of overboosting at the corner frequency. These different filter shape have different functions within an audio mixing environment. Thus, a person should not treat every filter shape as if it follow the same rules as the other filter shapes.
Certain Q value ranges may work better than others in particular situations. For instance, if a person uses a Q value between 0.5 and 0.8, they are using a very broad setting. This setting is beneficial for certain sounds.
A value between 1 and 2 is the standard setting for EQ. This setting allows engineers to make musical change to a track. Higher values of Q can be used for focused cuts or boosts.
Even higher values of the Q factor allow engineers to make surgical notch in specific sounds. Most tone shaping occurs in the middle of the Q value scale. However, most problem solving occur at the narrow end of the scale.
Some sounds require very narrow bandwidth of the Q value. For example, if a sound engineer is working with a sound with a 47 Hz bass mode, the Q value will have to be above 5 to ensure that the adjacent notes are left alone. Similarly, the cymbal ring in a band sound may require an even higher value of the Q factor.
However, using very high values for the Q factor may lead to the notch appearing very audible in the source material. In this situation, the engineer should widen the bandwidth or reduce the amount of gain reduction to hide the notch. The sample rate of the sound clip or analyzer smoothing will have an effect on how a person perceive the EQ settings.
If the upper edge of the frequency band approach half the sample rate of the sound clip, the bandwidth will change in ways that may not be reflected in the EQ band settings. Additionally, if the bandwidth of the analyzer smoothing is wider than the EQ band, the analyzer will not show the changes to the frequencies. EQ calculators may have field for entering the sample rate of the sound clip and the analyzer smoothing settings.
These fields will allow a sound designer to understand whether the EQ settings will show up in the analyzer. Additionally, the calculator may include fields for converting the EQ settings into various other representation of the same value. This will allow a person to understand the relationship between the data and the EQ controls.