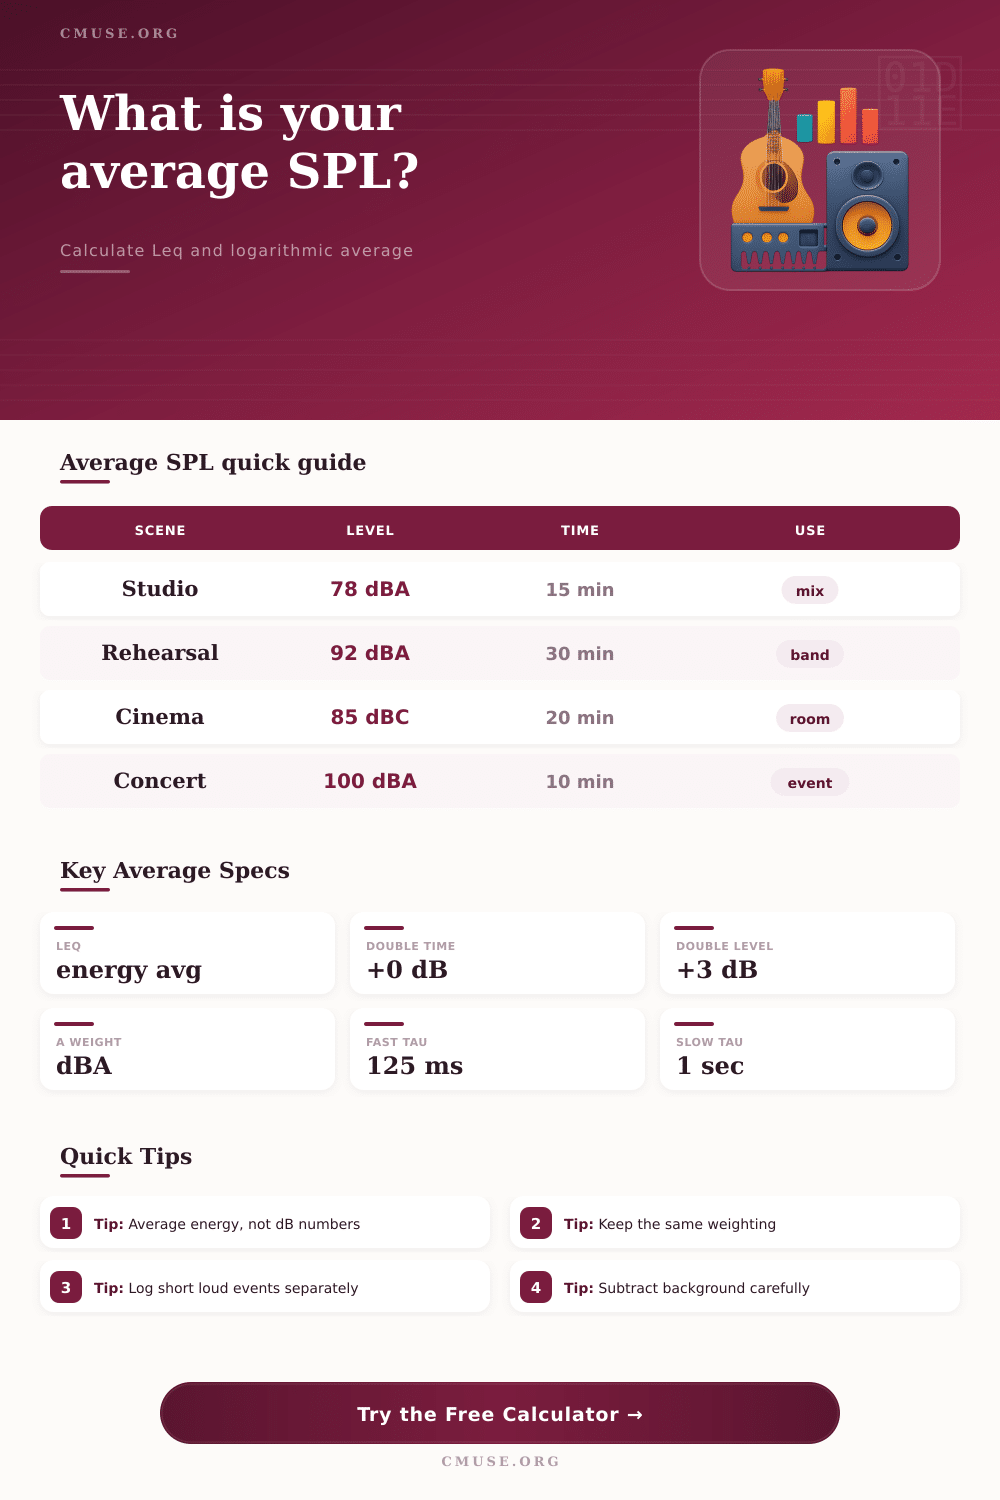
Calculate equivalent continuous level Leq, logarithmic average SPL, arithmetic average, time-weighted event visibility, target margin, and dose-style exposure from multiple sound pressure readings.
🎧Measurement Presets
📏Average SPL Inputs
Leq uses acoustic energy: each dB reading is converted back to linear sound energy, multiplied by time, averaged, then converted to dB again.
Durations weight the Leq result.
Use one weighting curve for every entered reading.
Short hits read lower when the event is shorter than the meter response.
Use a quiet-period SPL reading from the same location.
Correction is most reliable when the signal is at least 10 dB above background.
Used for the margin card and mix-level comparison.
Common occupational references use 85 dBA over 8 hours.
A 3 dB exchange halves allowable time for each 3 dB increase.
Used only to estimate how time weighting displays brief peaks.
Use
Reading
SPL (dB)
Duration (min)
Measurement note
Reading 1
Reading 2
Reading 3
Reading 4
Reading 5
Reading 6
Reading 7
Reading 8
Timed Leq uses duration. Equal Interval treats each enabled row as one equal-length sample.
Equivalent Continuous Level
80.0
dBA Leq
Logarithmic Average
79.5
equal reading energy average
Time-Weighted Peak View
82.0
fast response estimate
Target Margin
-5.0
dB below target
Enabled Reading Breakdown
Row
Measured
Used Level
Duration
Energy Share
📊Average Method Snapshot
79.4
Arithmetic dB Avg
25.0
Total Minutes
9%
Dose Reference
6.0
Reading Range dB
🎛Comparison And Spec Grid
LeqBest single number for changing sound over time because it averages acoustic energy.
Log AverageUseful when readings are equal interval samples with no separate duration weighting.
Arithmetic MeanShown for comparison only; it under-represents louder acoustic events.
Time WeightingFast, Slow, and Impulse affect meter display behavior, not the physical sound event.
📋Average SPL Reference Tables
Preset
Typical Range
Best Weighting
Reading Strategy
Nearfield Mix Check
74 to 83 dB
A or C
Sample quiet, verse, chorus, and loud pass.
Band Rehearsal
88 to 102 dB
A for risk, C for bass
Log timed sections and breaks separately.
Cinema Seat Sweep
78 to 92 dB
C or Z
Use multiple seats and representative program moments.
Club DJ Set
94 to 106 dB
A and C pair
Track Leq over set blocks, not only peak moments.
Podcast Room Noise
28 to 45 dB
A or Z
Measure steady room tone with HVAC states noted.
Meter Time Weighting
Reference Constant
Best Use
Average SPL Note
Fast
125 ms
General music level checks
Shows more movement; good for logging active passages.
Slow
1 s
Steady system tuning
Smooths short hits; useful for stable pink-noise reads.
Impulse
35 ms rise
Percussive or transient review
Highlights attacks better than Slow response.
Integrated Leq
time window
Formal average measurement
Preferred when the meter can integrate directly.
Peak Hold
instant peak
Crest and limiter checks
Peak is not the same as average level.
Average Method
Formula Basis
What It Answers
Common Mistake
Leq
time weighted energy
What steady level has the same total energy?
Using equal samples when durations differ.
Log Average
equal energy samples
What is the average of equal-interval readings?
Averaging dB values arithmetically.
Arithmetic Average
raw dB numbers
What is the simple numeric midpoint?
Treating it as acoustic energy.
Background Corrected
signal minus noise energy
What remains after steady noise is removed?
Correcting when signal is too close to noise.
Level Difference
Energy Ratio
Perceived Context
Average Impact
1 dB
1.26x
Small meter change
Can matter over long measurement windows.
3 dB
2x
Clear energy doubling
Dominates Leq if sustained for enough time.
6 dB
4x
Noticeably louder
Short loud sections raise Leq quickly.
10 dB
10x
Roughly twice as loud subjectively
Needs careful duration logging.
Leq tip: If one loud section is 10 dB above the rest, even a short duration can drive the final average upward.
Measurement tip: Keep mic position, weighting curve, and meter range consistent before comparing rows.
Sound travel in waves, and the experience of those waves is different for the human ear and an sound meter. A loud burst of sound may be powerful, but sound that hums at a steady level for many hours can be more fatiguing for the ear or more damaging to hearing. For these reason, sound meters measure average sound levels instead of peak sound levels.
The average sound level of a sound will tell you the steady level of sound that would contain the same amount of energy as the original measurement, and this number is the one that is use for mixing decisions. The duration of sound is another factor to consider in relation to sound meter. Sound that lasts for twenty minutes contain more energy than sound that lasts for thirty seconds, even if the sound meter read the same sound level for both periods of time.
Why Sound Meters Measure Average Levels
While you can use calculators to quickly calculate the energy of sound by plugging in the sound level and time measurement, the calculator avoids having to do the math calculations manualy. Furthermore, the calculator also allow for sound levels to be tested with either timed weighting or equal interval sampling, reflecting the sound meters setting for the sound measurements that