Signal To-Noise Ratio Calculator
Convert audio signal and noise measurements into SNR dB, voltage ratio, power ratio, noise floor, digital headroom, and ENOB-style converter reference.
🎙 Audio Measurement Presets
📏 SNR Inputs
Noise Floor What-If Table
| Noise Change | Noise Floor | SNR | Status |
|---|
📊 SNR Constants and Spec Grid
📐 Reference Tables
| Ratio Type | Formula | Example | Audio Use |
|---|---|---|---|
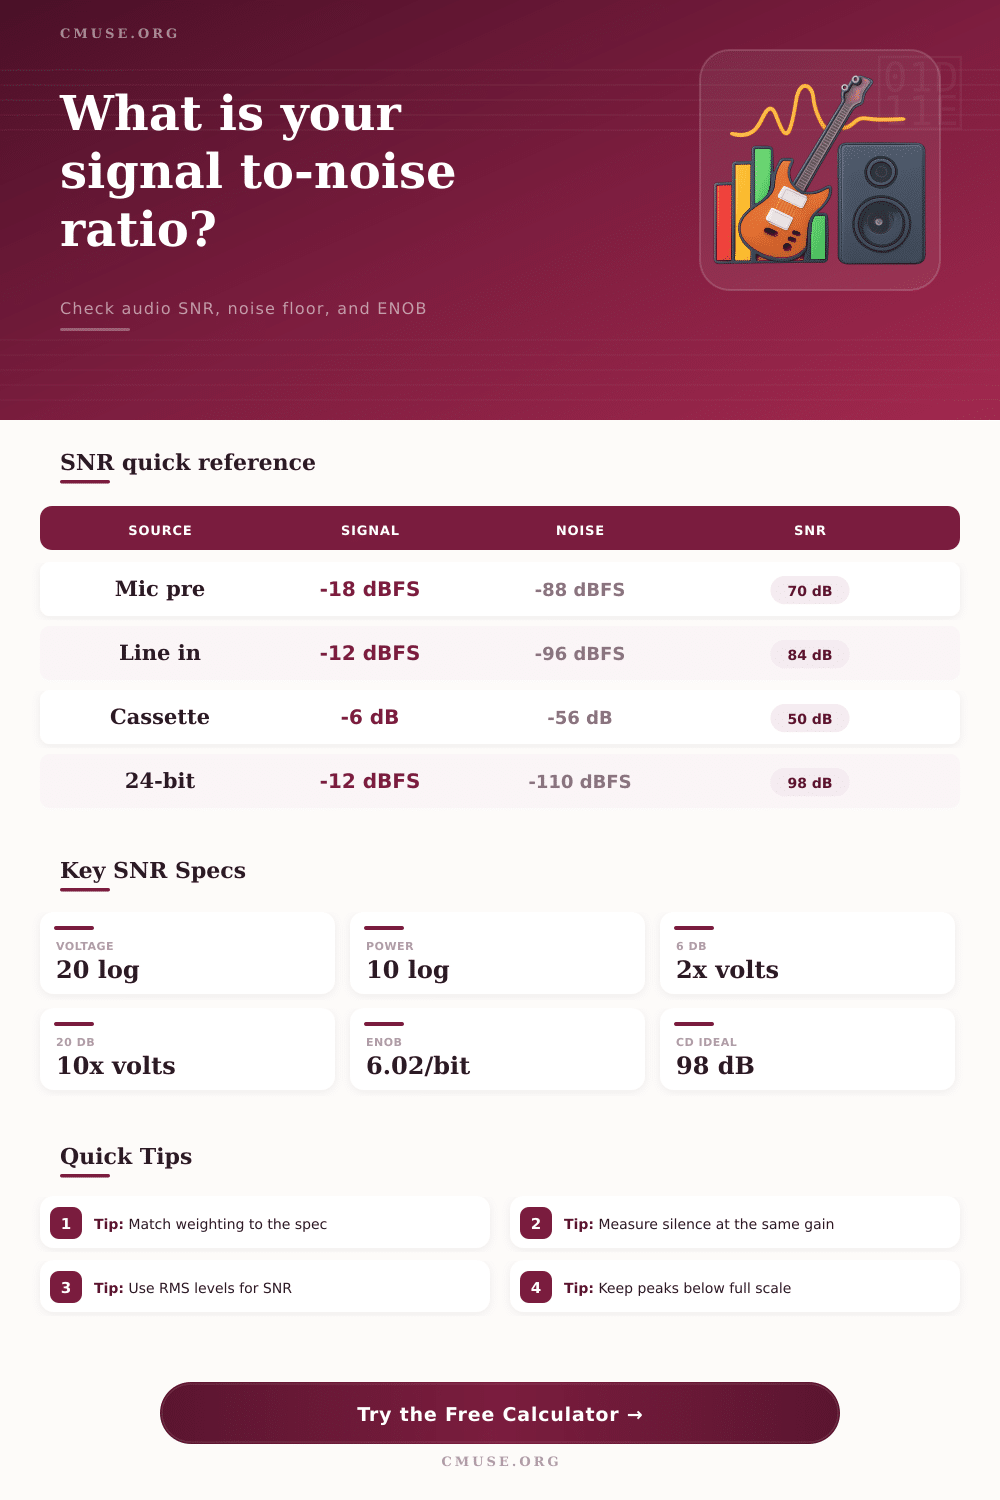
| Voltage ratio to dB | 20 log10(signal / noise) | 1000:1 = 60 dB | Use for RMS voltage, pressure, and amplitude levels. |
| Power ratio to dB | 10 log10(signal / noise) | 1,000,000:1 = 60 dB | Use when comparing watts through the same impedance. |
| dBFS level difference | signal dBFS - noise dBFS | -18 - -90 = 72 dB | Fast digital audio noise-floor check. |
| ENOB estimate | (SNR - 1.76) / 6.02 | 98 dB = 16 bits | Converter-style reference, not a complete audio quality score. |
| Measurement Context | Typical Useful SNR | Noise Check | Interpretation |
|---|---|---|---|
| Podcast or voice chain | 55-75 dB | Silence with mic gain set | Room noise often becomes the limiting factor before electronics. |
| Home studio line input | 75-95 dB | Input terminated or source muted | Enough for most music if peaks retain digital headroom. |
| Vinyl or cassette transfer | 45-70 dB | Lead-in or blank section | Media noise usually dominates over interface noise. |
| Mastering converter path | 95-115 dB | Analog chain muted at operating level | Compare weighting and bandwidth before trusting spec-sheet differences. |
| Bit Depth | Ideal SNR | Ideal Noise Floor | Practical Note |
|---|---|---|---|
| 12-bit | 74.0 dB | about -74 dBFS | Enough for control or lo-fi capture, tight for music production. |
| 16-bit | 98.1 dB | about -98 dBFS | CD-style reference when gain staging is sensible. |
| 20-bit | 122.2 dB | about -122 dBFS | Closer to strong modern converter performance. |
| 24-bit | 146.2 dB | about -146 dBFS | Ideal math exceeds many analog acoustic and electronic limits. |
| Preset Scenario | Signal Reference | Noise Reference | Likely Focus |
|---|---|---|---|
| Home Vocal Chain | -18 dBFS RMS | -86 dBFS RMS | Room tone, mic self-noise, and preamp gain. |
| Vinyl Transfer | -12 dBFS RMS | -64 dBFS RMS | Surface noise, cartridge hum, and grounding. |
| Live Console Bus | +4 dBu nominal | -72 dBu equivalent | Open-channel noise and bus summing. |
| Mastering ADC | -12 dBFS RMS | -112 dBFS RMS | Converter path and analog chain residual noise. |
A signal to noise ratio is a measurement that compare the amount of wanted sound to the amount of unwanted noise in a system. The signal to noise ratio is a single number that will tell you if a vocal sound is clear above the room tones in a room. Additionally, it will tell you if an acoustic guitar can be heard through compression within a system.
The signal to noise ratio will also allow you to determine if a mix within a live console sound open or if it sounds like the mix is quite crowded. By utilizing the calculator within this signal to noise ratio article, you can complete the math for this measurement once you have provide the measured levels to the calculator. This will give you an idea of how much noise your gain stage in your system is adding.
How to Use the Signal to Noise Ratio Calculator
The signal to noise ratio is not a figure that all engineering specifications within a system will have. Instead, this is a snapshot that will be taken under specific condition with your equipment. Should you change the bandwidth of your system, the weighting of your system, or the reference impedance within the system, the signal to noise ratio will change.
The signal to noise ratio calculator will allow you to match these specifications to your system so that you can get an accurate signal to noise ratio reading. For example, if you take a measurement using a 20 kHz filter and then compare that with the signal to noise ratio specifications of your system that use A weighting, you will find that the two measurements are not the same. They may differ by several decibels, which will play a major role in your decision of whether or not you should add an preamp to your system.
The voltage ratios and the power ratios within a system describe the same relationship but use a different method of calculation. The voltage ratio will use the 20 log formula because it is measuring voltage amplitude. On the other hand, the power ratio will use the 10 log formula because power is the amplitude levels squared.
Both these measurements is provided by the calculator. Engineers usually use the voltage ratio but use the power ratio to calculate the noise that a long cable run will create or the noise that multiple sources will contribute to your signal. In the digital age, there is one additional measurement within a signal to noise ratio calculator.
Once you have your signal in dBFS, you can measure the difference between your signal level and the noise floor. The signal to noise ratio calculator will translate your signal in dBFS into the amount of headroom that you have left before you reach full scale in your digital domain. Additionally, the signal to noise ratio calculator can also calculate the effective number of bits in your audio system.
This will help you to understand if your analog signal to noise ratio is the problem or your digital signal to noise converter is the problem. A 16 bit signal to noise converter can have a theoretical signal to noise ratio of 98 dB. However, real signal to noise converters will lose some of that signal to noise ratio due to jitter, the noise of the reference voltage, and limitations of the analog front end of the converter.
Seeing the theoretical signal to noise ratio of your converter to the actual signal to noise ratio that it create will allow you to decide if you should upgrade your signal to noise converter. The signal to noise calculator asks for the same measurements as you would measure in the field. You can input the RMS voltages directly or you can input the dBFS values.
In addition, you will have to adjust the full scale of your system so that the two measurements are comparably. The bandwidth will ask you to select the bandwidth of your measurement system. Additionally, the weighting will allow you to account for the fact that the human ear does not hear all frequencies the same.
You will also have to input the peak margin in your system. This will tell you how much headroom you will need in your system before your signal clip. Just as in any measurement, the signal to noise ratio in a system may differ from the ideal signal to noise ratio that is printed in the manufacturer specifications sheet for your equipment.
For example, your system may pick up acoustic noise from the room that exceeds the signal to noise performance of your microphone or preamp. In this case, the signal to noise ratio will calculate the electronic performance of your equipment correctly, but your audible signal will be limited by the noise of the room. If the signal to noise ratio that you calculate for your system is excellent but your sound file still sounds noisy, you know that the problem is an acoustic problem with your recording environment, not with your signal chain.
Impedance also plays a role in your signal to noise ratio calculations. Your signal to noise ratio calculator will use the impedance that you choose to calculate the power that your signal will create. This will allow you to compare, for example, the signal to noise ratio of your low impedance microphone to your high impedance instrument input.
The reference tables on this signal to noise ratio calculator website will show you the typical impedances for various pieces of audio equipment so that you can understand whether your signal to noise ratio is within normal limits for that type of application. The field for the target signal to noise ratio will allow you to enter the signal to noise ratio that you desire for your system. When the signal to noise ratio is calculated, this field will allow you to compare the calculated signal to noise ratio with your target signal to noise ratio.
This will tell you if your system meets the requirements that you have established, if it falls short of your target signal to noise ratio, or if it exceeds your target signal to noise ratio. This comparison will be more useful to you than if the signal to noise ratio were just presented as a single number. Each signal to noise ratio has some context to it that help define the measurement.
The field for the notes will allow you to enter any notes regarding the specific conditions of the signal to noise ratio calculation. For example, you can note the microphone that was used, the gain that was used with the preamp, and the weighting that was applied in measuring the signal. These notes will be helpful to yourself when you are returning to these files in your audio archive.
Like most measurements, the signal to noise ratio will allow you to make tradeoffs in your system. For example, you can lower the noise floor of your system by lowering the bandwidth of your signal. However, lowering the bandwidth will also mean that you will lose some of the transient information of the signal.
Additionally, you can increase the level of the signal by increasing the gain in your system. However, increasing the gain may result in clipping or distortion of your signal. These tradeoffs can be seen in your signal to noise ratio calculator to allow you to make informed decisions about your audio system.