STC Calculator for Sound Transmission Class
Fit TL band data to the STC contour, check total and single-band deficiencies, then estimate field loss from mounting and leakage.
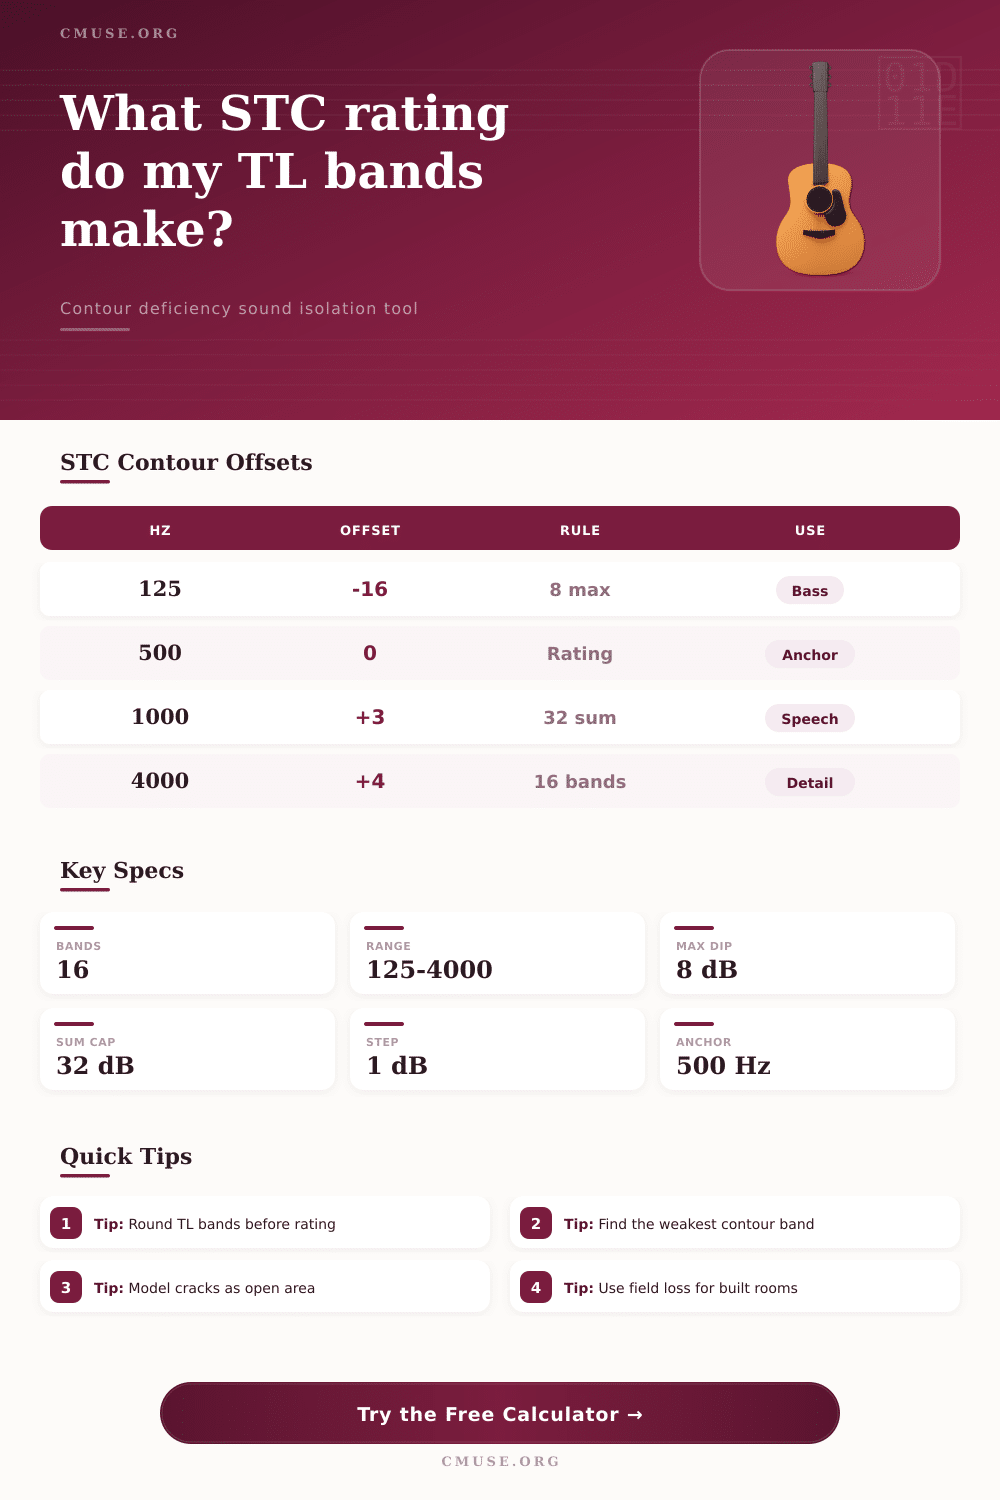
| Frequency | STC offset | Example at STC 45 | Calculation use |
|---|---|---|---|
| 125 Hz | -16 dB | 29 dB | Low-frequency contour point |
| 160 Hz | -13 dB | 32 dB | Low-mid contour point |
| 200 Hz | -10 dB | 35 dB | Transition band check |
| 250 Hz | -7 dB | 38 dB | Common weak wall band |
| 315 Hz | -4 dB | 41 dB | Speech/body band check |
| 400 Hz | -1 dB | 44 dB | Near contour anchor |
| 500 Hz | 0 dB | 45 dB | STC rating anchor |
| 630 Hz | +1 dB | 46 dB | Upper speech region |
| 800 Hz | +2 dB | 47 dB | Detail transmission check |
| 1000 Hz | +3 dB | 48 dB | Core speech intelligibility |
| 1250-4000 Hz | +4 dB | 49 dB | High-frequency plateau |
| Use case | Common target | What usually controls it | Calculator check |
|---|---|---|---|
| Podcast booth | STC 40-45 | Door seals and glass | Watch field adjustment |
| Practice room | STC 45-50 | 250-500 Hz wall dip | Review max deficiency |
| Control room window | STC 40-50 | Glass mass and air space | Compare preset bands |
| Live room partition | STC 50-60 | Flanking and low bands | Use field rating card |
| Floating room shell | STC 55+ | Structural isolation | Keep leaks near zero |
| Preset | Low-band behavior | Mid-band behavior | Likely STC range |
|---|---|---|---|
| Light Stud Wall | Limited 125-250 Hz loss | Moderate speech isolation | 30s |
| Insulated Stud Wall | Better low-mid control | Useful rehearsal separation | 40s |
| Double Stud Studio Wall | Strong low-band rise | High speech and music loss | 50s |
| Laminated Studio Glass | Mass limited at bass bands | Strong upper-band loss | 40s |
| Floating Room Partition | Best low-band contour fit | Critical isolation shell | High 50s |
| Step | Formula | Pass rule | Result meaning |
|---|---|---|---|
| Contour point | Trial STC + offset | Integer trial steps | Predicted required TL per band |
| Band deficiency | max(0, contour - TL) | No credit above contour | How far a band falls short |
| Total deficiency | sum(all band deficiencies) | Must be <= 32 dB | Overall contour fit quality |
| Single deficiency | max(band deficiencies) | Must be <= 8 dB | Worst frequency-band miss |
| Leak adjustment | -10 log10(f + (1-f)tau) | f = open area fraction | Composite rating with cracks |
Sound Transmission Class, or STC, is a numerical rating that describes how much airborne sound a wall, door, or window will block. While the Sound Transmission Class is not calculated as the averages of the sound transmission loss values for a given structure, the fitting of a reference contour to the measured sound transmission loss values for sixteen one-third octave bands calculates the STC value. The reference contour does not change during the calculation, but the position of the reference contour changes until an acceptable fit to the measured values is achieved.
The single number that is used to describe the STC value is the value at 500 Hz of the reference contour. A structure will receive a relatively low rating for frequencies at low bass ranges. As long as the structure do well at the other frequencies, it can receive a relatively respectible STC value.
What STC Means for Sound in Walls, Doors, and Windows
The opposite of this is true, however. If the structure performs poorly at any one frequency range of eight decibels or more from the reference contour, then it will be disqualified from receiving the STC value. This is to avoid giving building designers a means of claiming that there design blocks much sound when it will fail at any narrow frequency range.
The 250 Hz and 315 Hz frequency ranges are the most important in the calculation because many lightweight construction partitions fails at these frequencies. The sound isolation that can be achieved in a real room will be less than the STC value for that structure. Calculators that use these ratings can account for the mathematics involved in calculating the STC value for a structure by entering the sound transmission loss values for each band and the details about that structure.
The calculator can also model the difference between a perfectly sealed laboratory test specimen and the constructed structure. Any gaps in the structure will be represented as open areas in the model. Sound will travel through these gaps.
Field adjustment can account for sound transmission along flanking paths to the structure, which are not tested in the laboratory. The target Sound Transmission Class value must be chosen based off the sound isolation that is desired in the structure. Human speech easily travels through the 500 Hz to 2000 Hz frequency range.
A sound transmission class value of forty-five will make it difficult for normal speech to be understood on the other side of the wall. Music contains low frequencies that move through the structure’s mass-air-mass resonances. Sound isolation for rooms used to mix or hear music will require an STC value of fifty or higher.
A difference between an STC value of forty-five and an STC value of fifty will be noticeable in the bass frequencies. An STC value of forty-five will require additional effort to achieve an STC value of fifty. Changes to the depth of the cavity in the wall will change the reference contour fit to the sound transmission loss values for each band.
The same is true for changing the decoupling of the studs in the wall. A single STC value will not reflect these changes. The method in which the wall is mounted is also important.
A double stud wall can achieve an STC value of around fifty in the laboratory. If the construction of the wall allows for flanking paths for sound to travel around the structure (if electrical boxes are installed on both sides of the wall, or if the wall has a gap at the top plate, for instance), the sound will travel along those paths rather than being blocked by the wall. A mounting adjustment in the calculator will reflect the impact of flanking paths.
If you wish to test the Sound Transmission Class of a door or a window, you can input the sound transmission loss values for the door or window. The program can estimate how well that door or window will reduce the sound transmission through the opening. This information can be used as a means of making decisions about how to construct the structure.
Sound transmission loss values are collected through sound transmission tests in a sound laboratory. In these tests, the source and receiving rooms are highly reverberant rooms, and the structure to be tested completely fills the opening between the source and receiving rooms. This minimizes sound traveling along flanking paths.
For these reasons, the STC value calculated from these measurements will be lower then the published STC value for the structure. A calculation tool can calculate both the laboratory value and the field-adjusted STC value. The two values can be compared to determine if the structure will satisfy the desired STC value when it is constructed in the field.
Sound transmission loss values are rounded to the nearest whole decibel prior to calculations. The reference contour uses whole decibel values, and the deficiencies of the structure are evaluated on a whole decibel scale. Rounding the sound transmission loss to the nearest whole decibel will ensure that small inconsistencies in the sound transmission loss of a structure will not impact the calculated STC value.
In comparing different construction methods, it is useful to know that changing the insulation in a wall or studs spacing will change the STC of the structure by no more than a point or two. Changing the air gap between studs or adding a second independent frame will change the STC of the structure to a greater extent. The reference contour was created through sound listening tests.
The reference contour uses slightly different offsets for each frequency. Offsets for low frequencies are relatively large negative numbers because the human ear is less sensitive to low frequencies. The offsets for the midrange and high frequencies are larger positive numbers to reflect the fact that speech contains more energy at these frequencies.
The STC value correlates with how humans judge sound isolation. It does not, however, reflect structure-borne sound or impact noise from footsteps on the floor. These two measurements use different test methods.
The output will contain four numbers. These are the value of the reference contour, the total deficiency, the weakest single band of sound transmission loss, and the field-adjusted estimate of the STC value. These four numbers will allow you to determine how well the structure will perform.
For instance, if the weakest band of sound transmission loss is at 250 Hz, and the field-adjusted estimate of the STC value is less than the target STC value, then both the bass and the construction of the structure need to be adjusted. If the total deficiency is relatively low and the field-adjusted STC value reaches the target STC value, then the structure will be suitable for construction. Achieving good sound isolation requires some compromise between the mass of the structure, its stiffness, decoupling, and sealing properties.
While the Sound Transmission Class value for a construction element is only one part of sound isolation, the STC is the most common value used as a summary of sound isolation properties. Understanding the origin of the Sound Transmission Class value and the field adjustments to the calculated STC will allow you to turn the STC value into a construction plan.