NTC Curve Calculator
Fit a Noise Transmission Class contour from one-third octave transmission loss data, then inspect the summed and single-band deficiencies that control the rating.
| Band | Corrected TL | Contour TL | Deficiency |
|---|---|---|---|
| 125 Hz | 31 dB | 34 dB | 3 dB |
| 250 Hz | 41 dB | 43 dB | 2 dB |
| 500 Hz | 50 dB | 50 dB | 0 dB |
| 1000 Hz | 53 dB | 53 dB | 0 dB |
| Frequency Band | Contour Offset | NTC 50 Contour | Scoring Use |
|---|---|---|---|
| 125 Hz | -16 dB | 34 dB | Low-frequency wall mass check |
| 250 Hz | -7 dB | 43 dB | Low-mid coincidence and cavity check |
| 500 Hz | 0 dB | 50 dB | Rating anchor band |
| 1000 Hz | +3 dB | 53 dB | Speech isolation control band |
| 2000 Hz | +4 dB | 54 dB | Upper-band leakage check |
| 4000 Hz | +4 dB | 54 dB | Seal and flanking sensitivity check |
| Assembly Type | Typical NTC Range | Common Weak Band | Best Use |
|---|---|---|---|
| Single stud drywall wall | NTC 32 to 42 | 125 to 250 Hz | Light isolation between practice spaces |
| Resilient channel wall | NTC 42 to 52 | 160 to 315 Hz | Improved speech and instrument separation |
| Double stud isolated wall | NTC 55 to 68 | 125 to 200 Hz | Recording rooms and loud rehearsal rooms |
| Solid masonry partition | NTC 45 to 60 | Coincidence dip varies | High mass isolation with controlled flanking |
| Acoustic door set | NTC 35 to 55 | 500 to 2000 Hz | Maintaining wall rating at openings |
| Laminated acoustic glass | NTC 38 to 52 | 1000 to 3150 Hz | Studio sightlines and control room windows |
| Scenario | Suggested Target | Primary Concern | Curve Check |
|---|---|---|---|
| Home studio vocal booth | NTC 45 to 55 | Speech and headphone bleed | Watch 500 Hz to 2 kHz deficiency |
| Drum practice room | NTC 60 to 70 | Kick and tom energy | Watch 125 Hz and 160 Hz deficiency |
| Control room window | NTC 40 to 50 | Glass coincidence region | Check 1 kHz to 3.15 kHz dip |
| Stage-to-lobby partition | NTC 50 to 60 | Amplified music leakage | Check total deficiency after correction |
| Podcast suite demising wall | NTC 48 to 58 | Voice privacy | Check 250 Hz to 1 kHz smoothness |
| Formula | Expression | Inputs | Meaning |
|---|---|---|---|
| Transmission loss from NR | TL = NR + 10 log10(S/A) | S area, A absorption | Corrects level difference to a test-style TL curve |
| Noise reduction | NR = L1 - L2 | Source and receive levels | Measured room-to-room level difference |
| Band deficiency | Def = max(0, contour - TL) | Contour and corrected TL | Only unfavorable gaps count against rating |
| NTC acceptance | Sum def <= 32 and max def <= 8 | All 16 bands | Highest passing contour becomes the NTC rating |
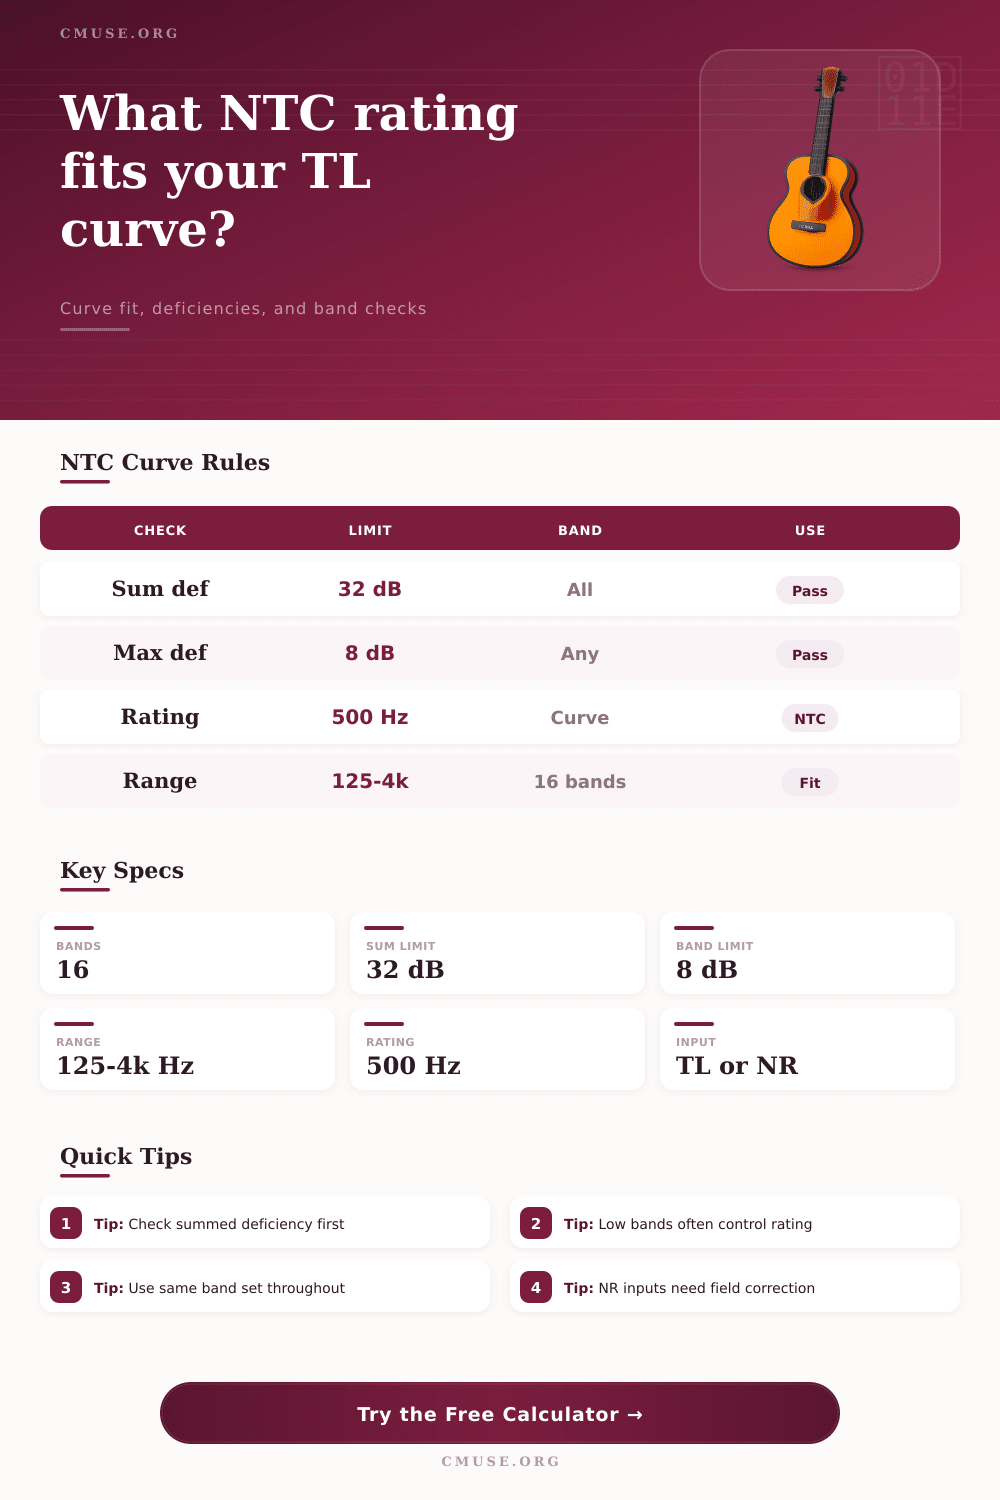
An NTC rating is a single number that represent the sound insulation performance of an assembly, such as a wall, a door, or an window. The NTC rating is useful in that it can convert all of the different measurement of the transmission loss of a construction element to a single number that can be used to make a decision about that construction element. The NTC rating isnt the average of all of the measurements of the sound insulation properties of that element.
Instead, the NTC rating uses two rules to arrives at the number for that element. The first rule is that the total shortfall of all band must be no more than 32 dB. The second rule is that no band can exhibit a shortfall of more than 8 dB.
What the NTC rating is and how it works
These two rules are important in that they ensures that no construction element has a high NTC rating due to having a major leak of sound at a single frequency. The NTC rating is determined by plotting the performance of an element as a contour with an anchor at 500 Hz. All other frequency bands is plotted at a fixed offset either above or below the 500 Hz anchor.
The low frequency bands are plotted below the 500 Hz anchor due to the mass and stiffness of the materials at those frequencies. The higher frequency bands are plotted above the 500 Hz anchor because materials naturaly exhibit higher sound insulation at higher frequencies. Each measurement of the sound insulation performance of an element is entered into a calculator that shifts the entire contour up or down until it passes both rule for the NTC rating.
The highest NTC rating that meet both rules is the NTC rating that can be assigned to the construction element. The various inputs into the calculator will determine whether the values entered are laboratory measurements of sound transmission loss or field measurements of noise reduction. Sound transmission loss accounts for both the area of the test specimen and the absorption of sound in the receiving room.
Noise reduction does not account for either the area of the test specimen or the absorption of sound in the receiving room. Thus, you must correct noise reduction values for area and receiving room absorption before they are entered into the calculator. Without making this correction, the values that are entered into the calculator will exhibit incorrect values for the NTC rating.
Many people make the mistake of not making this correction, leading to incorrect NTC ratings that dont match the laboratory measurements of sound transmission loss. The various construction assemblies that are evaluated with the NTC rating will rarely have smooth sound transmission loss curves. Most building assemblies will have weak points at specific frequency.
For instance, a single stud wall with two layers of drywall will exhibit weak sound isolation between 125 Hz and 250 Hz. This weak point result from the mass air mass resonance of the drywall on each side of the stud. This weak point will prevent the sound isolation performance of that wall construction from receiving an NTC rating that is high relative to other construction elements in a building.
If the studs are isolated from the drywall, or if resilient channels are installed between the drywall and studs, the sound isolation between those two bands will improve, potentially increasing the NTC rating of that wall by eight to fifteen points. These comparison can be made with the calculator. Doors and glazing will exhibit the same type of weakness in their sound isolation performance.
For instance, an acoustic door may exhibit high ratings for sound isolation above 500 Hz, but the NTC rating of that door may be low due to the seals around the perimeter of the door. Likewise, laminated glazing may have high sound isolation values for most frequencies, but at 2000 Hz the sound insulation will be less due to the coincidence between the wavelength of sound at 2000 Hz and the thickness of the glass. The narrow bandwidth of these weak areas is why the limit is placed on the single band shortfall to 8 dB.
Without that limit, a manufacturer may produce a product with high sound isolation performance except at certain frequency where sound can escape the door or glazing. Field measurements of sound isolation may be different than measurements taken in the laboratory. For instance, the absorption in a receiving room may be different from the absorption in a sound transmission loss test room.
The absorption in the field may be affected by the presence of furniture, carpeting, or people in the space. The sound levels of the sound source may also be different from those in a test room. For instance, a drum kit will contain high levels of sound in the 125 Hz band while a podcast microphone will exhibit low sound levels at that frequency.
The ability to enter optional sound source and receiving room levels is important to convert sound reduction to transmission loss. This ability to enter these levels is important because it will prevent the comparison of two different types of measurements from being made. The target NTC rating for a construction element should be based off the use case of the rooms that utilize that construction element, not upon the material of that construction element.
For instance, a vocal booth in a home may require an NTC rating of around 45 to 50 to prevent the sound of headphones from entering a microphone. In contrast, a room that is to be used for practicing playing drums may require an NTC rating of around 60 because sound at low frequencies is to be controlled in that room. Thus, if the calculated NTC rating is three points above the target, the construction element has breathing room.
If, however, the calculated NTC rating is three points below the target, the construction element can be evaluated to determine at which frequencies the sound isolation is failing. While the NTC rating is a helpful measurement for construction elements, the NTC rating should not be considered to be a guarantee of the performance of that construction element. The performance of a construction element in the real world can be affected by flanking paths for sound, the installation of the construction element, and the structure of the building in which that construction element is installed.
Furthermore, the NTC rating is based upon sixteen one-third octave bands between 125 Hz and 4000 Hz. Any deviation from this banding will invalidate the comparison of NTC ratings between construction elements. Thus, the banding used in measuring sound isolation should be kept the same between all tests to ensure that the measurement of sound isolation is accurate and reliable.
Reference tables exist that display the NTC ratings that is achieved by various construction elements. For instance, single stud walls tend to have NTC ratings of around the low forties. Double stud systems that are isolated from the drywall have NTC ratings that can reach the low sixties.
Masonry walls are somewhere in between these two construction elements. Furthermore, the coincidence dips in masonry walls tend to exhibit at different frequencies from those of lightweight construction elements. These reference tables may help to set expectations for a construction element, but they are not a replacement for measuring the sound isolation of the individual construction elements.
Overall, the NTC rating will help to indicate whether or not the construction of a wall or a door will meet the goal that is set up for its sound isolation performance. If the NTC rating for the construction element is high enough, the construction element can be built with confidence. If the NTC rating for the construction element is too low, the deficiency within that construction element can be evaluated to determine in which frequency bands the construction element will fail to provide the sound isolation performance that is required.
Thus, the NTC rating is a helpful tool for making decisions about construction elements and the sound isolation performance that they will achieve. The NTC rating for a construction element is useful in that it provides a single number to the building and sound isolation engineer and it also provides a look at the deficiency in that construction element.