Often, audio engineer will encounter the issue of needing to separate two different sound from a recording, such as a kick drum and bass guitar, since each of these sounds are present within the same frequency range. Audio engineers may attempt to separate these two sounds with an equalizer, but find that the resulting sound from the kick and bass guitar often sound muddy. The human ear and brain do not perceive frequencies in the same way that a linear ruler measure distances between points.
For instance, it may feel like there is a large distance between 100 and 200 Hz, but the distance between 10,000 and 10,100 Hz may seem very smallly to the human brain. The solution to this problem are to use the Bark scale to understand how the human brain perceives these frequencies. The Bark scale maps raw frequencies to how human ears hears those frequencies.
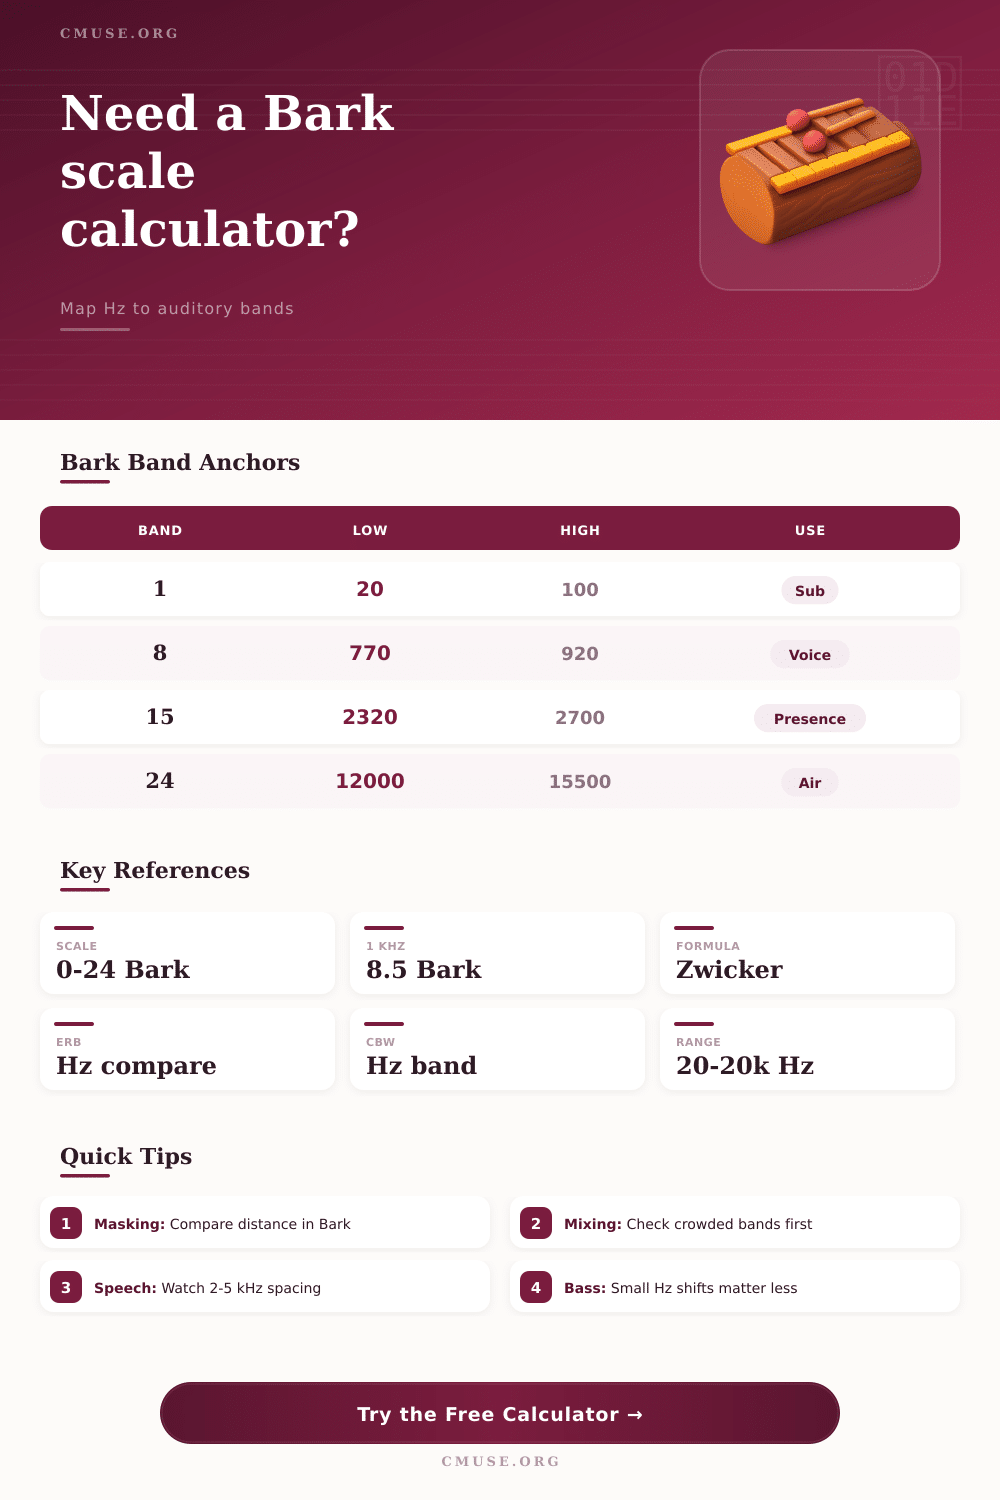
How to Use the Bark Scale to Fix Muddy Sound
The human ear filters frequencies within critical bands. If two sounds falls within the same critical band, the sounds will interfere with each other; this masking of sounds is called auditory masking. Auditory masking occur between sounds that are too close to each other on the Bark scale.
Auditory masking does not rely upon the loudness of the sounds in order to occur. Instead, auditory masking occurs based off the location of the sounds on the Bark axis. Many audio engineers makes mistakes with mixing based off their trust in the linear representation of the equalizer.
By converting frequencies to Bark values, engineers can see the actual separation between sounds. For example, moving a frequency a small amount in the high frequencies may affect many hertz, but only a very small fraction of a Bark scale. Therefore, engineers may believe that they have separated two sounds in the mix, but Bark scale analysis show that they are still too close together.
There are different formulas for perform this frequency to Bark scale conversion. The most common is the Zwicker formula, which calculates the Bark scale values between the sub-bass frequencies and the air frequencies. The Traunmuller formula is another option, and is preferred for task related to speech or hearing issues.
The Schroeder approximation is another approximation for calculating the Bark scale, but it is less precise then the other two formulas. The critical bandwidth is another value that audio engineers can calculate. The critical bandwidth provides information about the width of the filter for the human ear at each frequency value.
For instance, if the sound of a kick and bass guitar fall within the same critical bandwidth, it is likely that auditory masking will occur. Therefore, the kick and bass guitar may sound like a single blurry mass; they is occupying the same critical band of the human ear. Because the kick and bass are occupying the same critical band of the human ear, the human brain cannot separate the two sounds.
This same logic apply to understanding vocal presence and sibilance. For example, between 2 and 5 kHz is a range of frequencies that the human brain is very sensitive to. As a result, any shift in frequency in this range will have a large impact on the vocal sound.
In contrast, many hertz can be shifted in the sub-bass region of sound without changing the Bark scale value of the sound. The goal of audio engineering is not to avoid auditory masking altogether. Instead, the goal of audio engineering is to manage auditory masking.
Intentional auditory masking can be used to help glue the sounds together into a well-mixed song. However, unintentional auditory masking result in a cluttered soundscape. By understanding the Bark scale, engineers can decide whether a clash between two frequencies is the result of mathematical coincidence or an engineering problem.
Furthermore, by using the Bark scale instead of hertz values in the mixing stage, audio engineers can process their audio in a way that mimic the human brains processing of sound frequencies.