Mel Scale Calculator
Convert between frequency and perceived pitch, then build mel-spaced bands for speech, music analysis, MFCC filters, and psychoacoustic reference work.
🎵Fast Psychoacoustic Presets
🎚Mel Conversion Inputs
📊Mel Scale Reference Data
| Frequency | HTK mel | ERB rate | Common audio use |
|---|---|---|---|
| 80 Hz | 122.2 mel | 3.7 ERB | Low speech and bass fundamentals |
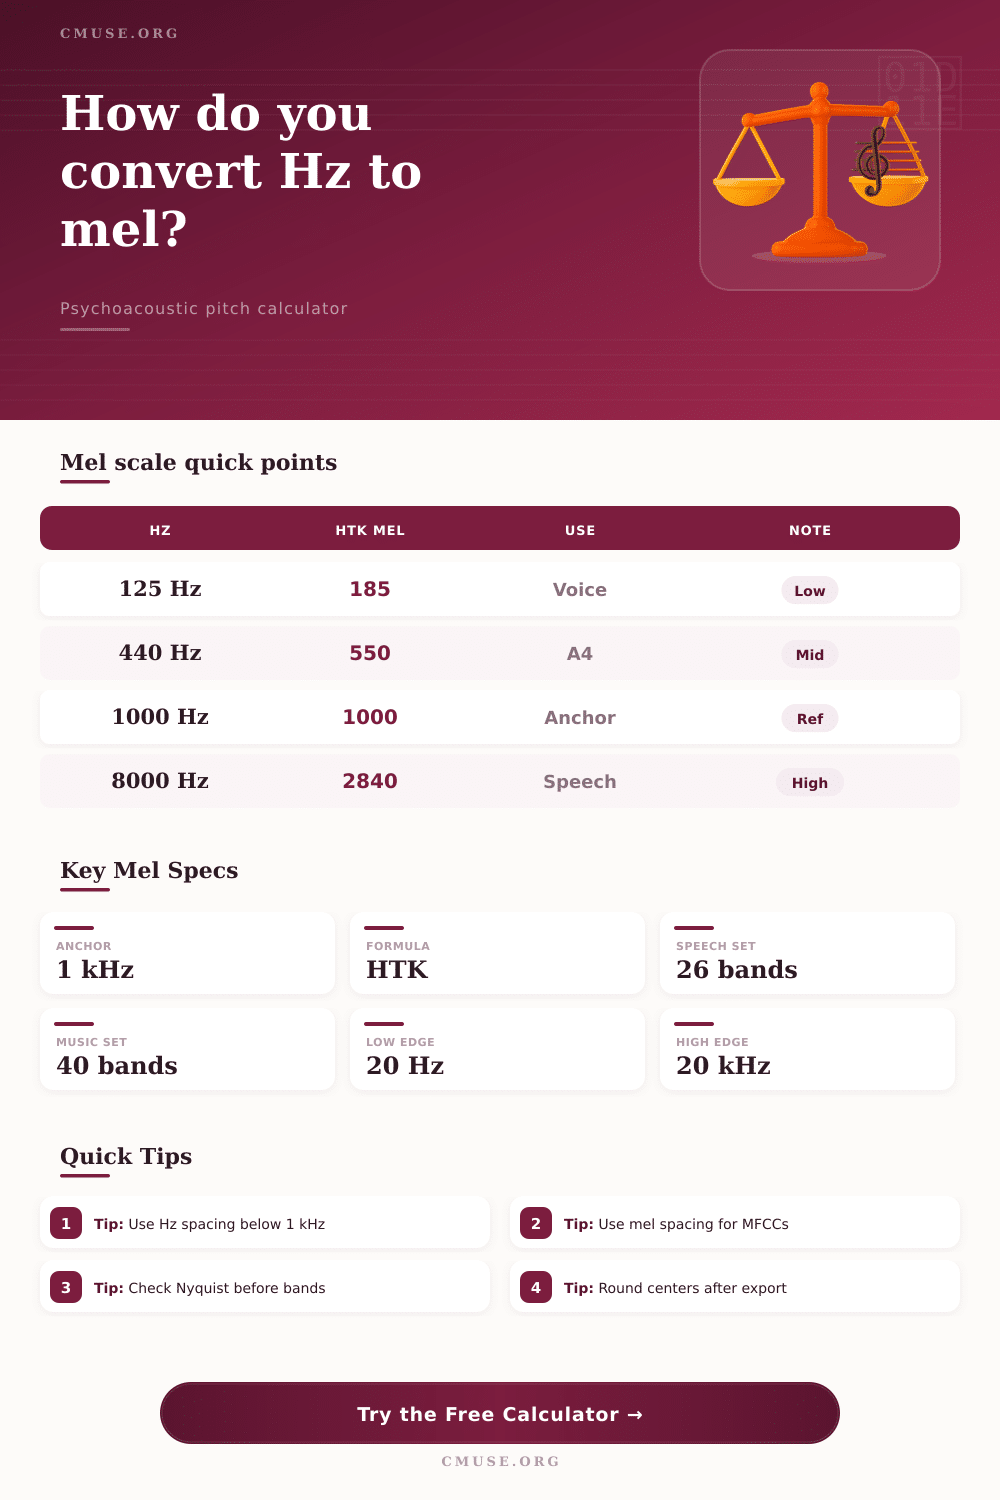
| 125 Hz | 185.0 mel | 5.0 ERB | Low male voice and room-mode checks |
| 440 Hz | 549.6 mel | 10.9 ERB | Concert A4 and musical reference tuning |
| 700 Hz | 781.8 mel | 13.0 ERB | Typical first-formant neighborhood |
| 1000 Hz | 1000.0 mel | 15.6 ERB | Reference point for classic mel matching |
| 3400 Hz | 2117.4 mel | 27.3 ERB | Telephone speech upper passband |
| 8000 Hz | 2840.0 mel | 33.3 ERB | Wideband speech and brightness cues |
| 20000 Hz | 3816.9 mel | 40.6 ERB | Nominal full-range hearing limit |
| Formula | Forward mapping | Best use | Interpretation note |
|---|---|---|---|
| HTK / O'Shaughnessy | 2595 log10(1 + f / 700) | Speech recognition, quick Hz to mel work | 1000 Hz maps almost exactly to 1000 mel |
| Natural log equivalent | 1127 ln(1 + f / 700) | Codebases that prefer natural logarithms | Numerically equivalent apart from rounding |
| Slaney | Linear below 1 kHz, log above | Auditory Toolbox and many MFCC pipelines | Reports Slaney mel units, not HTK mel numbers |
| ERB-rate companion | 21.4 log10(1 + 0.00437f) | Critical-band comparison only | Included as context, not a mel replacement |
| Application | Frequency span | Typical filters | Why it works |
|---|---|---|---|
| Narrow speech MFCC | 80 to 7600 Hz | 20 to 26 | Tracks phonetic detail while avoiding wasted high bands |
| Wideband speech | 50 to 8000 Hz | 32 to 40 | Preserves consonant energy for cleaner features |
| Music timbre analysis | 20 to 20000 Hz | 40 to 64 | Gives dense low-frequency centers and broader top bands |
| Vocal formant study | 250 to 3500 Hz | 12 to 20 | Covers F1 through F4 with perceptual spacing |
| Telephone band | 300 to 3400 Hz | 16 to 24 | Matches limited-band speech intelligibility tests |
| Region | Perceptual behavior | Hz spacing effect | Design implication |
|---|---|---|---|
| Below 500 Hz | Pitch changes are finely resolved | Small Hz steps create noticeable mel changes | Use more low-frequency centers for bass and voice fundamentals |
| 500 to 1000 Hz | Transition toward logarithmic hearing | Mel and Hz spacing both remain easy to interpret | Good anchor region for checking formula choice |
| 1 to 5 kHz | Speech clarity and presence dominate | Equal mel steps become wider in Hz | Ideal range for formants and consonant features |
| Above 5 kHz | Brightness cues spread across broad bands | Large Hz spans may equal modest mel changes | Keep Nyquist and sample rate limits visible |
The way that human hearing perceive sound frequency is not linear, but instead different than the way that a computer perceive sound frequency. A computer perceives sound in terms of hertz, which are unit of cycles per second. However, the human brain dont perceive hertz in the same way as a computer and does not understand them as a straight lines.
Instead, the human brain understands sound frequencies in a way that prioritize certain frequencies over others within the sound that is heard. Therefore, because the human brain do not perceive sound frequencies in a linear fashion, sounds of equal distance on a piano key will not sound equal to each other. In order to account for the way the human brain perceives sound frequencies, engineers utilize the mel scale.
How the Mel Scale Matches Human Hearing
The mel scale is useful in that it allow for the human to translate the physical units of hertz into the pitch that the human brain perceives. Humans are more sensitive to changes in low frequencies than high frequencies, which is why audio equalizers has wider bands of high frequencies. When converting from hertz to mels, or vice versa, there is different formulas that may be used.
For example, speech recognition software often uses the HTK formula in relation to how the human brain process language. In contrast, auditory toolboxes often use the Slaney scale in relation to MFCC analysis. Each of these formulas can be used for each project, but mixing the two may lead to shifts in the filters for the software, which may lead to inaccuracy in the softwares analysis of sound.
In the creation of a filter bank based on the mel scale, various considerations must be made. For speech recognition software, the filters should be dense in the low frequencies, which contain the vocal frequencies of an individual that speak, but become broader at higher frequencies, which contain the hiss of consonants in speech. A calculator may be of great use in translating mel frequencies to hertz, which allows for engineers to more easy form a filter bank for certain tasks.
For example, certain tasks may require more band of filters than others, such as recognizing a telephone signal versus recognizing a musical composition. In addition to the mel scale, another consideration is the Nyquist frequency. The Nyquist frequency is half the rate at which the signal is sampled.
Digital sounds cannot contain frequencies that is higher than the Nyquist frequency. For instance, using a sample rate of 16,000 Hz results in a Nyquist frequency of 8,000 Hz. In this example, any filter bank that have frequency measurements higher than 8,000 Hz will be of no use to the digital audio software.
Thus, a tool to measure the FFT placement of the filters can ensure the software return no errors. Another value is the Equivalent Rectangular Bandwidth, or ERB rate. Similar to the mel scale, the ERB rate consider the way that the human ear perceive sound.
Due to this similarity, many auditory engineer use this value in medical and hearing research projects. However, those who work in the fields of music or speech applications use mel scale due to its simplicity. Overall, the mel scale may be used for a variety of projects related to sound.
However, the reason for the use of the mel scale is to ensure that the computer software that recognize sound frequencies does so in the same way as the human brain and ears. Thus, regardless of the task that is to be perform with the software, engineers must stop thinking of sound in terms of linear bands of frequencies, and must instead think of sound in terms of a curve of frequencies so that the audio engineering software return accurate results. Youll find that people should of looked at teh curve more closely.
It is actualy a lot of work to make sure the results is correct.