Octave Matrix Calculator
Build exact octave and fractional-octave matrices, then compare band centers, edges, and span density across an audio range.
📋 Presets
⚙ Matrix Settings
Breakdown
📈 Generated Matrix
| Step | Octave shift | Center | Low edge | High edge | Width |
|---|---|---|---|---|---|
| Choose a preset or calculate to generate the matrix. | |||||
📊 Reference Tables
| Octave band | Center | Low edge | High edge |
|---|---|---|---|
| 31.5 Hz | 31.5 Hz | 22.3 Hz | 44.5 Hz |
| 63 Hz | 63 Hz | 44.5 Hz | 88.9 Hz |
| 125 Hz | 125 Hz | 88.4 Hz | 176.8 Hz |
| 250 Hz | 250 Hz | 176.8 Hz | 353.6 Hz |
| 500 Hz | 500 Hz | 353.6 Hz | 707.1 Hz |
| 1 kHz | 1000 Hz | 707.1 Hz | 1414.2 Hz |
| 2 kHz | 2000 Hz | 1414.2 Hz | 2828.4 Hz |
| 4 kHz | 4000 Hz | 2828.4 Hz | 5656.9 Hz |
| 8 kHz | 8000 Hz | 5656.9 Hz | 11313.7 Hz |
| 16 kHz | 16000 Hz | 11313.7 Hz | 22627.4 Hz |
| Family | Steps / oct | Step ratio | Best use |
|---|---|---|---|
| Octave | 1 | 2.0000 | Broad scan |
| Third octave | 3 | 1.2599 | RTA work |
| Sixth octave | 6 | 1.1225 | Fine detail |
| 12-TET | 12 | 1.0595 | Musical pitch |
| 24-TET | 24 | 1.0293 | Microtonal |
| Task | Range | Family | Why it fits |
|---|---|---|---|
| Room modes | 20-300 Hz | 1/3 octave | Shows low-end peaks |
| Sub crossover | 25-500 Hz | 1/6 octave | Shows tight overlaps |
| Vocal clarity | 100-8 kHz | 1/3 octave | Tracks speech bands |
| Mastering | 20-20 kHz | 1/3 octave | Good all-around view |
📝 Spec Grid
💡 Tips
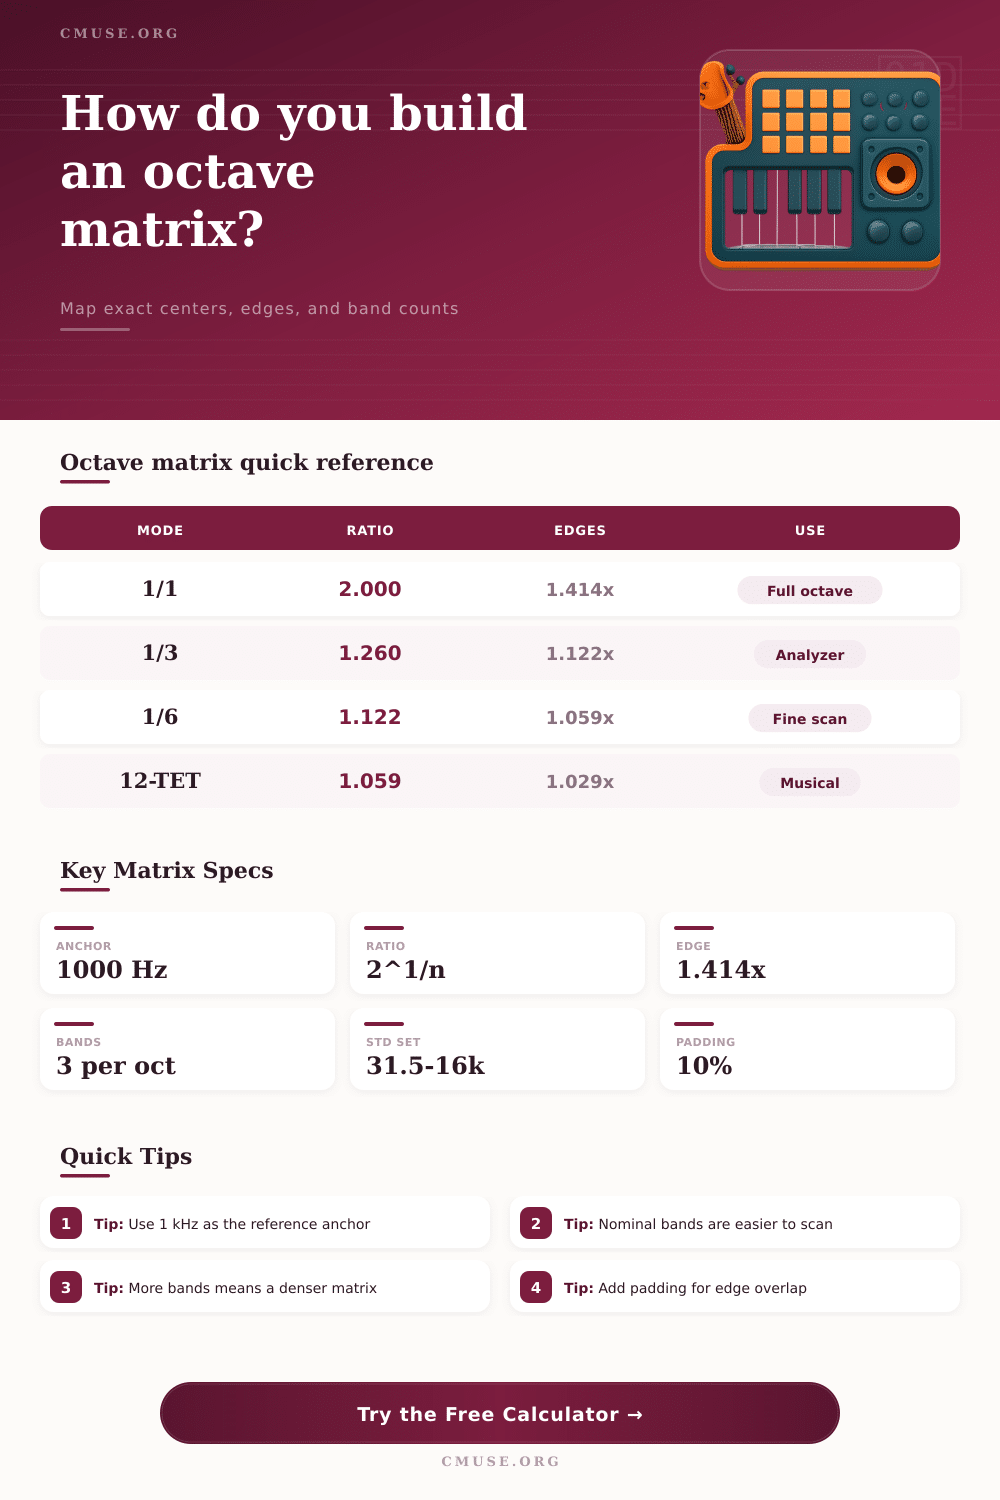
Use this octave matrix calculator to map center frequencies, edge bands, and span size across an audio range. It is handy for RTA work, crossover planning, and spectrum checks.
An octave matrix is a tool that can divide the audio frequency spectrum into different bands of frequencies and allow a person to see the frequency data geometricaly. The audio frequency spectrum covers a wide range of frequencies, and splitting the spectrum into different bands of frequencies allow a person to analyze the audio waveform more clear. An octave matrix is useful for dividing the audio frequencies into bands because audio frequencies is logarithmic in nature, and splitting them according to a geometric ratio allows for more accurate reflections of how the human ear perceives sound.
The division of an octave matrix is based off the concept of an octave. Within an octave, the highest frequency is the lowest frequency times two. For instance, one octave may have a range of 707 Hz to 1.4 kHz, which is represented as being centered at 1 kHz.
What is an octave matrix?
Within this octave, a person can choose to divide the octave into other frequency bands, such as thirds. If a person divided the octave using thirds instead of dividing it into two bands, the size of each frequency band would use a specific step ratio. This step ratio would ensure that the size of each frequency band were geometrically proportional to the previous frequency band.
If a person chose to use linear spacing of frequencies to divide the octave into bands instead of a geometric step ratio, the low frequencies would not be visible on the matrix. However, using a geometric step ratio would make the bands appear even to a person. To build an octave matrix, a person must start with a reference anchor for the frequencies.
The person will set the reference anchor to 1 kHz. Using the step ratio that was established for the size of each frequency band, a person can create the other frequencies that will be represented in the matrix. Using both a positive and negative application of the step ratio will allow a person to build an octave matrix that covers a wide range of frequencies.
For instance, a person may want to build the matrix for frequencies ranging from 80 Hz to 8 kHz. Furthermore, a person must compute the edges of each frequency band. These edges create a frequency band spectrum, and each frequency band should be overlapping with the other frequency bands within the matrix to ensure that no frequency within the audio file are missed.
Additionally, a person can use padding for the frequency bands. Padding creates additional frequency bands outside the desired range for the audio file to ensure that the edges of the frequency bands isnt cut off on the audio file. A person can create an octave matrix with any density of frequency bands.
However, the higher the density of the bands, the more complex the analysis of the audio will be. For instance, a 1/1 octave matrix will create broad bands of frequencies. A 1/1 octave matrix is useful for analyzing audio files in general.
However, a 1/3 octave matrix will create bands of frequencies that are narrower than those created within a 1/1 octave matrix. A 1/3 octave matrix will allow a person to see individual frequencies more clearly. For instance, a 1/3 octave matrix can allow a person to separate the analysis of a frequency at 38 Hz from that at 50 Hz.
However, a 1/3 octave matrix will take more scanning to analyze an audio file then a 1/1 octave matrix. A person can also create even denser octave matrices, such as 1/6 octave matrices or 12-TET matrices that is useful for resolving narrow frequency issues. The layout of an octave matrix is important to the individual using the matrix.
A person can arrange the bands of frequencies from low to high for spectrum plot analysis. A person can also create an octave matrix that is centered on a particular frequency to analyze a specific part of the audio file. For instance, a person can arrange a matrix to be centered on 3 kHz to analyze specific frequency bands related to vocal sounds.
Furthermore, a person can use padding for the octave matrix to provide a buffer for the lowest or highest frequencies to ensure they are not lost to the analysis. An octave matrix can be used in many different ways. For example, if a person wants to master their audio file in the frequency range from 100 Hz to 10 kHz, they may use a 1/3 octave matrix.
For subwoofer crossovers, a 1/6 octave matrix can be used. Additionally, within live sound, a 1/6 octave matrix can help to find feedback between 250 Hz and 8 kHz. Finally, an octave matrix is used in hearing tests to allow the human ear to perceive sound that is created with the same ratio as the ear perceives sound.
Youll find that it’s a very moddern way to look at sound, and it should of been used sooner.