⚡ Peak Power to RMS Calculator
Convert peak, RMS, and peak-to-peak power for audio & electrical signals
| Peak Power (W) | RMS Power (W) | Peak-to-Peak (W) | Power (dBW) | Power (dBm) |
|---|---|---|---|---|
| 10 | 7.07 | 20 | 8.5 dBW | 38.5 dBm |
| 25 | 17.68 | 50 | 12.5 dBW | 42.5 dBm |
| 50 | 35.36 | 100 | 15.5 dBW | 45.5 dBm |
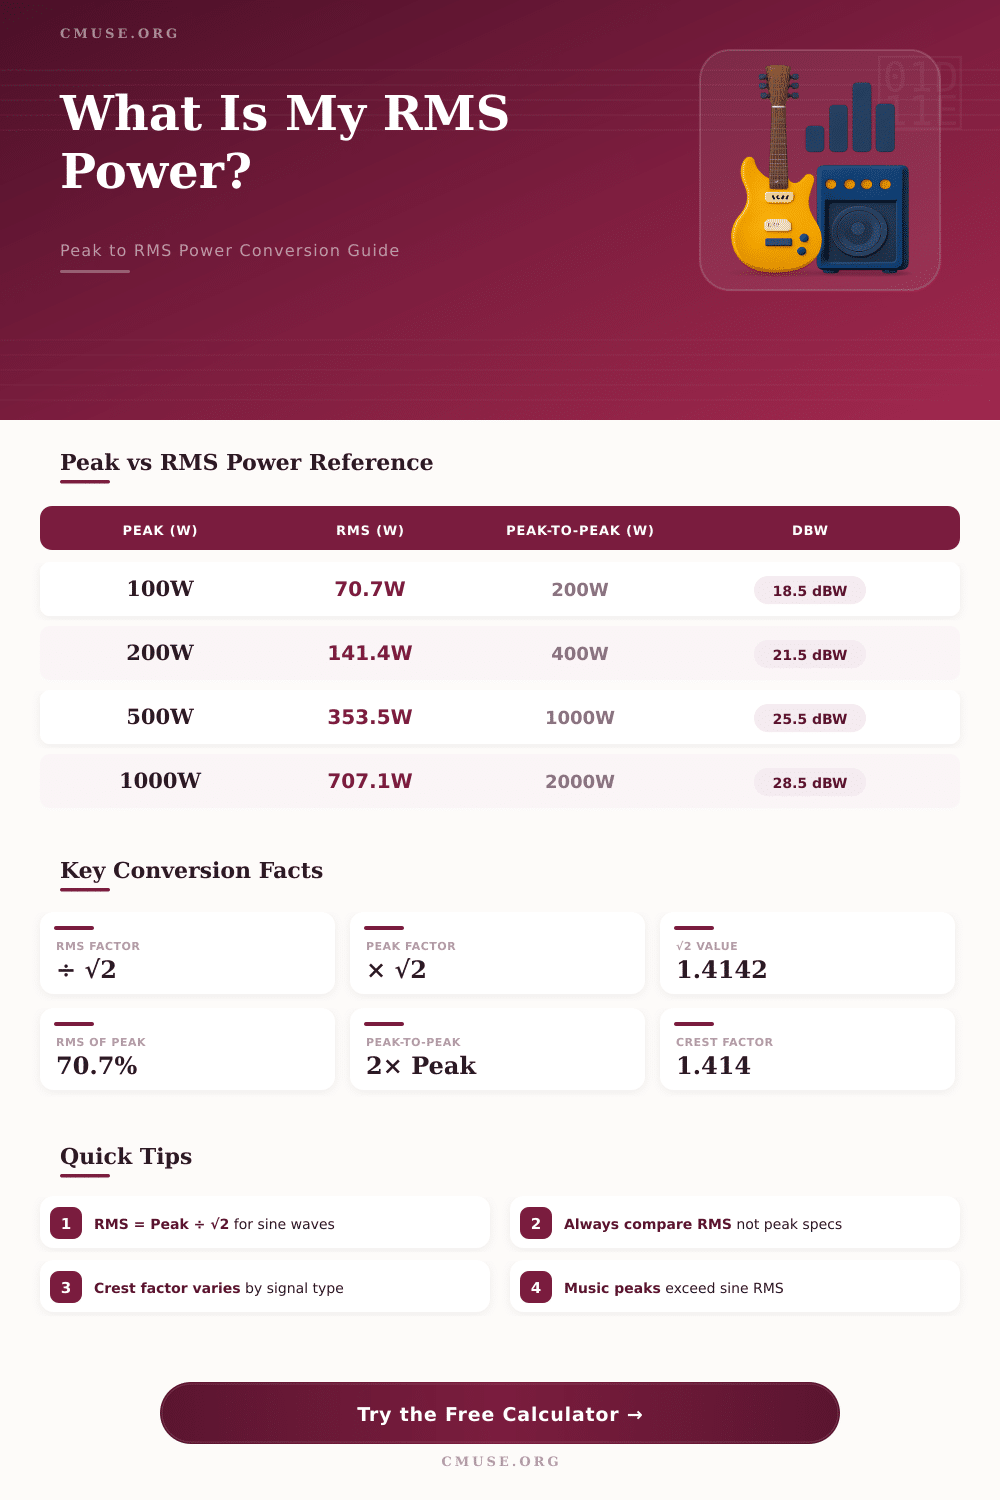
| 100 | 70.71 | 200 | 18.5 dBW | 48.5 dBm |
| 200 | 141.42 | 400 | 21.5 dBW | 51.5 dBm |
| 300 | 212.13 | 600 | 23.0 dBW | 53.0 dBm |
| 500 | 353.55 | 1000 | 25.5 dBW | 55.5 dBm |
| 750 | 530.33 | 1500 | 26.8 dBW | 56.8 dBm |
| 1000 | 707.11 | 2000 | 28.5 dBW | 58.5 dBm |
| 2000 | 1414.21 | 4000 | 31.5 dBW | 61.5 dBm |
| 5000 | 3535.53 | 10000 | 35.5 dBW | 65.5 dBm |
| 10000 | 7071.07 | 20000 | 38.5 dBW | 68.5 dBm |
| RMS Power (W) | Peak Power (W) | RMS Voltage (V) | Peak Voltage (V) |
|---|---|---|---|
| 10W | 14.14W | 8.94V | 12.65V |
| 25W | 35.36W | 14.14V | 20.00V |
| 50W | 70.71W | 20.00V | 28.28V |
| 100W | 141.42W | 28.28V | 40.00V |
| 200W | 282.84W | 40.00V | 56.57V |
| 500W | 707.11W | 63.25V | 89.44V |
| 1000W | 1414.21W | 89.44V | 126.49V |
| Waveform | Crest Factor | RMS = Peak ÷ | Peak = RMS × | RMS % of Peak |
|---|---|---|---|---|
| Sine Wave | 1.4142 (√2) | ÷ √2 | × √2 | 70.71% |
| Square Wave | 1.0000 | ÷ 1 | × 1 | 100% |
| Triangle Wave | 1.7321 (√3) | ÷ √3 | × √3 | 57.74% |
| Music (typical) | ~2.0 – 4.0 | ÷ 2 to 4 | × 2 to 4 | 25–50% |
| Sawtooth Wave | 1.7321 (√3) | ÷ √3 | × √3 | 57.74% |
| White Noise | ~3.0 – 5.0 | ÷ 3 to 5 | × 3 to 5 | 20–33% |
| Advertised Peak (W) | True RMS (W) | Crest Factor Used | Application |
|---|---|---|---|
| 100W PMPO | ~5–10W | ~3.2 to 4.5 | Budget PC speakers |
| 200W Peak | 141W | 1.414 | Home stereo |
| 500W Peak | 353W | 1.414 | PA speaker |
| 1000W Peak | 707W | 1.414 | Subwoofer |
| 2000W Peak | 1000W | 2.0 | Car audio |
| 4000W PMPO | ~200–400W | ~3.2 to 4.5 | Budget car amp claims |
When you look at the specifications for audio amplifiers, there are two differntly measurements for power. One of those measurements are for the peak power of the amplifier, and the other is for the RMS power of the audio amplifier. Peak power measure the highest point of the audio signal, while RMS power measures the average power of that audio signal over time.
RMS power, which stand for root mean square, is the measurement that describes the amount of power that an audio amplifier or speaker can handle. Because peak power only measures the tallest spikes of an audio signal, the peak power rating dont indicate how an audio device will perform over long period of music playback. Peak power ratings measure the tallest spikes in an audio signal, such as when a snare drum hit.
RMS Power and Peak Power
RMS power ratings calculates the average power within that signal. For a signal that is a perfect sine wave, such as a tone of a single frequency, the RMS power will be 70.7% then the peak power measurement. The mathematical equation calculates the alternating current in the signal, which smooth out the spikes of the signal.
Real music is not a series of perfect sine waves, however, and the peaks in the power measurement of music can be two to four times more high than the average power level of that music. Thus, the ratio of the peak power to the RMS power of music will vary depending upon the type of waveform of the music that is play. Audio equipment manufacturers often use the power rating for peak power instead of RMS power because the peak power is a higher number than the RMS power.
For example, a product may state that it has 200W of peak power, but that power is only 141W of RMS power. Additionally, some manufacturers will use a number call the PMPO, or peak music power output. PMPO is not a standardized measurement of power output, and the power measurement isnt accurate for audio equipment.
PMPO is often used to inflate the power measurement of audio equipment for marketing purpose. Since the PMPO rating is usually much higher than the RMS power rating of the device, you should of always look for the RMS power specification to determine how your equipment will function. Speaker impedance, measured in ohms, is another factor to consider when choosing audio equipment.
By changing the impedance from 8 ohms to 4 ohms, the current will double. Efficiency is another factor that determine how much power the amplifier will use. Amplifiers such as Class D use less input power than other amplifiers to output the same amount of power.
If you do not consider impedance and efficiency in your audio system, you may find that your amplifier is clipping at the audio equipment. The crest factor is the ratio between the peak power and the RMS power of the signal. For a sine wave, the ratio is 1.414.
For a square wave, the ratio is 1.0. Since music is not comprised of only square waves, the crest factor will be between 2 and 4. The higher the crest factor for the music, the higher the peak in the signal relative to the average power.
To create an audio system that works efficient, you need to match the RMS power of the amplifier with the RMS power of the speakers. If the power is not match correctly, the equipment will reach its thermal limits. When audio equipment reaches its thermal limits, the sound that the device outputs may become muffled.
Scan the specification sheet of the audio equipment to find the RMS power figure. Also consider the impedance and crest factor of the music you play. By focusing on RMS power figures rather than the peak power figures of the audio equipment, you can ensure that your audio equipment provides clean power to the speaker and that it function well throughout your music.