📈 Bass Diffusion Model Calculator
Forecast product adoption over time using the Bass Diffusion Model (BDM). Enter your innovation & imitation coefficients plus market size to generate a full adoption curve.
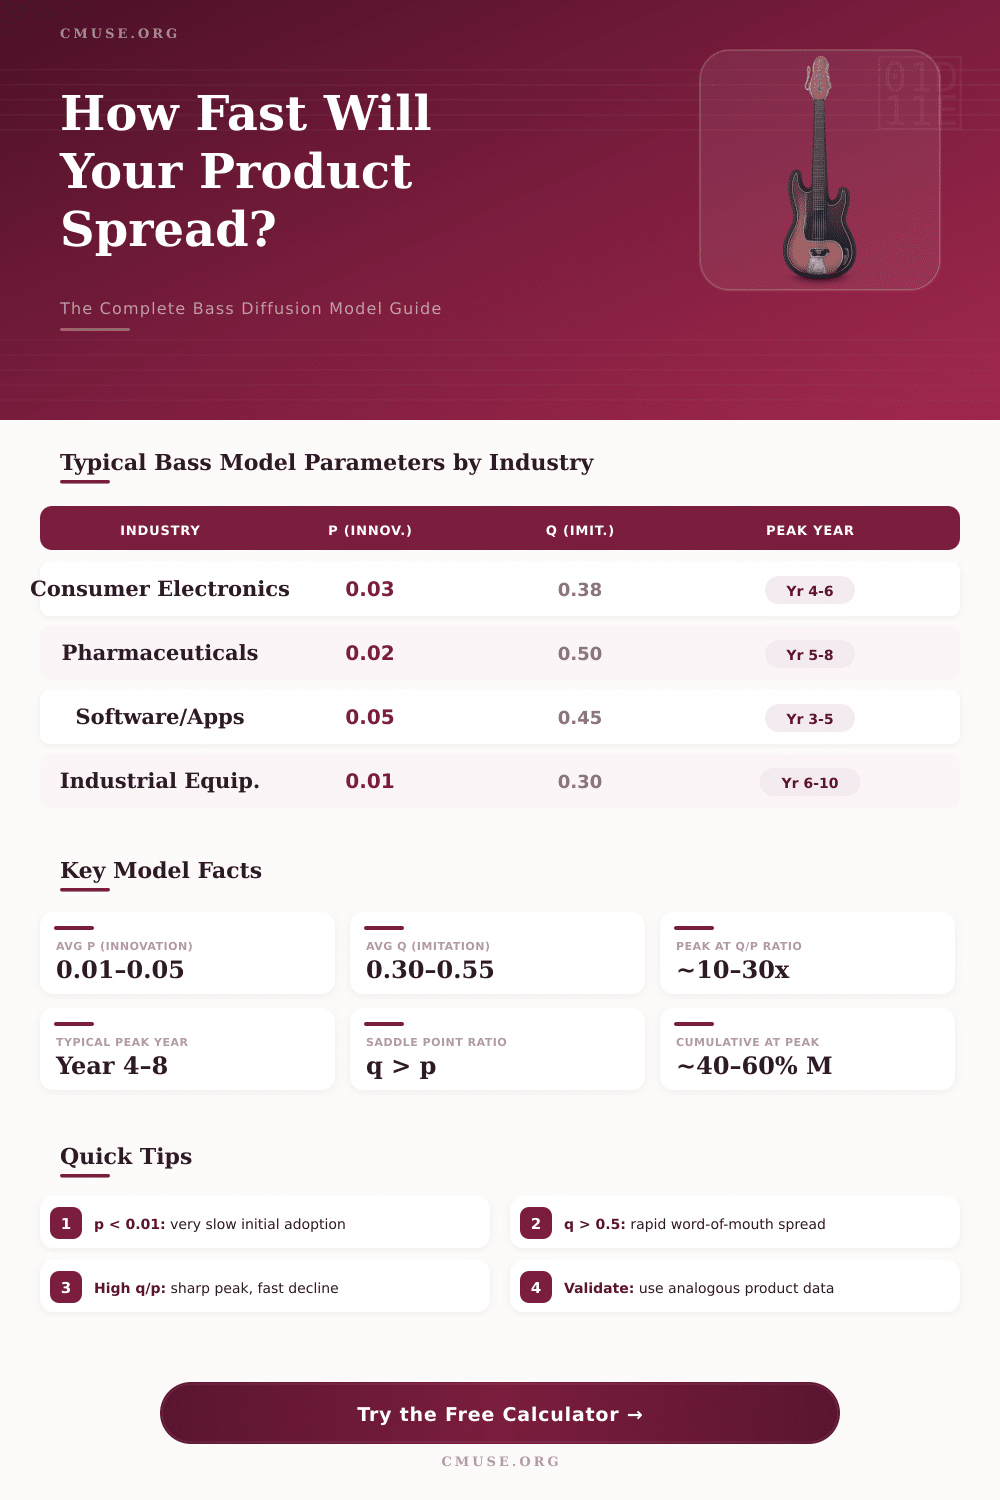
| Industry / Category | p (Innovation) | q (Imitation) | q/p Ratio | Typical Peak Year | Saddle Point? |
|---|---|---|---|---|---|
| Consumer Electronics | 0.03 | 0.38 | 12.7 | Year 4–6 | Yes (q > 2p) |
| Pharmaceutical Drug | 0.02 | 0.50 | 25.0 | Year 5–8 | Yes |
| Software / App | 0.05 | 0.45 | 9.0 | Year 3–5 | Yes |
| Industrial Equipment | 0.01 | 0.30 | 30.0 | Year 6–10 | Yes |
| Streaming Service | 0.04 | 0.42 | 10.5 | Year 4–6 | Yes |
| Social Media Platform | 0.025 | 0.55 | 22.0 | Year 4–7 | Yes |
| Medical Device | 0.015 | 0.35 | 23.3 | Year 5–9 | Yes |
| Gaming Product | 0.06 | 0.48 | 8.0 | Year 3–5 | Yes |
| Electric Vehicle | 0.008 | 0.28 | 35.0 | Year 7–12 | Yes |
| Parameter | Formula | Description | Typical Value |
|---|---|---|---|
| Peak Sales Time (t*) | ln(q/p) / (p+q) | Year when annual sales peak | Year 3–10 |
| Peak Sales (S*) | M(p+q)² / (4q) | Max units sold in a single period | 5–15% of M |
| Saddle Point Condition | q > 2p | Dip after initial launch spike | Common in q/p > 2 |
| Cumulative at Peak | N(t*) = M(q-p)/(2q) | Adopters at sales peak | ~40–60% of M |
| Innovation Sales | p * (M – N(t)) | Sales driven by advertising | Declines over time |
| Imitation Sales | q * N(t) * (M–N(t)) / M | Sales driven by word-of-mouth | Peaks then falls |
| Total Period Sales | Innovation + Imitation | Combined annual adoptions | Bell-shaped curve |
| Milestone | % of Market (M) | Adopter Segment | Bass Model Phase |
|---|---|---|---|
| 2.5% penetration | 2.5% | Innovators | Early takeoff |
| 16% penetration | 16% | Early Adopters | Growth phase begins |
| 50% penetration | 50% | Early Majority | Near/at peak sales |
| 84% penetration | 84% | Late Majority | Declining sales |
| 97.5% penetration | 97.5% | Laggards | Market saturation |
In 1969, Frank Bass created a mathematical model that describes how new products spread between folks and become part of their everyday lives through time. He worked on it together with Everett Rogers, the scientist that later wrote the famous book about the spread of new ideas. In the center of that model stands a basic differential equation.
Nothing too tricky, to follow the relationships between those that already accepted the product, and those that yet did not do that.
How New Products Spread with the Bass Model
Real depth appears when one observes how current users and possible users work on one another. The model dealt with the calculation of probability that some person will accept a product in some moment, before that indeed will happen. Two main coefficients lead that probability.
One of them, p, takes in outside causes… Like advertisement or talk from folks outside your circle. The second, internal factor, shows how current users urge others to acceptance.
One commonly applies the Bass Diffusion Model to predict how new inventions, products or techniques will spread in a particular market. It proved itself as a reliable resource for projecting the spread of new ideas, when actual data from the world backs it. One compares it with other methods, like ARIMA, but it aims especially at foreseeing the growth of products.
Moreover, stays the question of how to practically use the math (whether discrete), sharing time in separate periods, or continuously, without pauses.
Here is the main weakness of the classical Bass Diffusion Model: it assumes that all in the group accept products almost the same. No real diversity between different people, no details in the pace with which some maybe take a new idea. Moreover, it does not consider cases when folks buy something and later give up on it.
That forms quite a heavy restriction, if one thinks.
Scientists settled some of those gaps. One way introduces network structures to study how the spread adjusts when folks relate in more complex ways. Another mode allows that the coefficients of influence range according too time instead of stay permanent, and it follows also how interest declines because of many sources.
Some extended the model to complex nets, including scale-free nets, where the connections adjust greatly.
Creation of agent based simulations for the Bass Diffusion Model and its versions became simpler thanks to programs like NetworkX and NetLogo. The main force of the model rests in its simplicity… One can receive deep insights about the acceptance of products without sinking into too much complexity.
Even so, it is only one of many resources for studying the spread of technologies, so one must carefully think when and how to use it. Cycles of product life do not last forever, which limits natural accuracy of predictions based on spread according to Bass. Overall, it stays well studied and genuinely helpful forunderstand how new ideas spread in markets.